


\documentclass[a4paper, 12pt, oneside]{article}
\usepackage{pst-all}
\usepackage{tikz}
\begin{document}
\tikzset{every path/.style=thick,
acteur/.style={
circle,
fill=black,
thick,
inner sep=1pt,
minimum size=.13cm
},
curvy line/.style={decorate,,rounded corners=2pt,decoration={random steps,segment length=3mm,
amplitude=1mm}}}
\tikzset{curvy line/.style={decorate,decoration={snake,segment length=8.5mm,
amplitude=1mm}}}
\begin{figure}[hbt!]
\begin{center}
\begin{tikzpicture}[scale=.7,every label/.append style={font=\scriptsize}]
\begin{scope}
\node (a1) at (0,0) [acteur,label=below:{$x$}]{};
\node (a2) at (1.5,0) [acteur,label=below:{$x'$}]{};
\node (a3) at (1.5,1.5) [acteur,label=left:{}]{};
\node (a9) at (0,1.5) [acteur,label=left:{}]{};
\node (a7) at (.75,3) [acteur,label=right:{}]{};
\draw (a1) -- (a2);
\draw [dashed] (a2) -- (a3);
\draw [dashed](a3) -- (a7);
\draw [dashed] (a1) -- (a9);
\draw [dashed] (a9) -- (a7);
% \draw (3,1.5) circle (.8);
% \draw (.75, 4.6) circle (.8);
% \draw (-1.5, 1.5) circle (.8);
\draw (1.5,1.5) -- (2.7,1.5);
\draw [dashed] (1.5,1.5) -- (2.7,1.1);
\draw [dashed] (1.5,1.5) -- (2.7,1.8);
\draw [dashed] (.75,3) -- (.99,4.2);
\draw [dashed] (.75,3) -- (.50,4.2);
\draw [dashed] (0,1.5) -- (-1.12,1.8);
\draw [dashed] (0,1.5) -- (-1.12,1.2);
% \draw [dotted](1.85,.5) to[bend left=100] (1.85,2.5);
% \draw (2.5,2.5) arc (0:315:1.75cm and 1cm);
% \draw[dashed] (1.5,1.5)[bend left=90] arc (0:180:1.5cm);
\draw (.75,3) -- (.75,4.2);
\draw (0,1.5)-- (-1.1,1.5);
\node at (.75,-1) {$U_1$};
\node at (-1.6,1.5) {\scriptsize{$T_1$}};
\node at (0.75,4.8) {\scriptsize{$T_2$}};
\node at (3.3,1.5) {\scriptsize{$T_3$}};
\end{scope}
\end{tikzpicture}
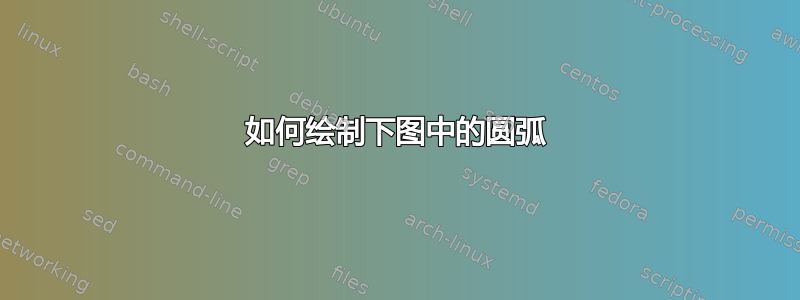
\caption{The solid edge in $U_1$ denotes the matching edge. The graph $U_1$ lies in $\mathcal{U}_1$ while $U_2$ lies in
$\mathcal{U}_2$. }
\end{center}
\end{figure}
\end{document}
图中圆弧曲线怎么画?给个思路。
答案1
像这样吗?

\documentclass[tikz, margin=3mm]{standalone}
\usetikzlibrary{positioning}

\begin{document}
    \begin{tikzpicture}[
node distance = 12mm and 12mm,
     acteur/.style = {circle, draw, fill=black,
                      minimum size=1.5mm, node contents={}
                      },
every label/.style = {font=\footnotesize},
 every path/.style = thick,
        bend angle = 15
                        ]
% nodes
\node (a1)  [acteur,label=below:$x$];
\node (a2)  [acteur, above=of a1];
\node (a3)  [acteur, above right=of a2];
\node (a4)  [acteur, below right=of a3];
\node (a5)  [acteur, below=of a4,label=below:{$x'$}];
% lines
\draw [dashed]  (a1) -- (a2) -- (a3) -- (a4) -- (a5);
\draw           (a1) -- node[below=5mm] {$U_1$} (a5);
% lines at T_1
\draw (a2) -- ++ (-1,0) node[left] {$T_1$};
\draw[dashed] (a2) to[bend  left] ++ (-1,-0.5)
              (a2) to[bend right] ++ (-1, 0.5);
% lines at T_2
\draw (a3) -- ++ (0,1) node[above] {$T_2$};
\draw[dashed] (a3) to[bend  left] ++ (-0.5,1)
              (a3) to[bend right] ++ ( 0.5,1);
% lines at T_3
\draw (a4) -- ++ (1,0) node[right] {$T_3$};
\draw[dashed] (a4) to[bend  left] ++ (1, 0.5)
              (a4) to[bend right] ++ (1,-0.5);
    \end{tikzpicture}
\end{document}