

我从中复制了代码这个帖子制作旭日图,但我需要做 2 处修改,我还无法解决:
添加
%到文本中,并且是为图中的两个饼图创建一个合并的图例。
\%当我尝试在以下数字后插入例如(\%以粗体显示)
\arctext[N1][firstgreen][15pt](1.5)(90)(-3.6){|\footnotesize\bf\color{white}| 1 26 **\%**};
整个事情都崩溃了。
如果有人能指出我如何进行这两项修改,那将非常有帮助。
\documentclass{article}
\usepackage{xcolor}
\definecolor{firstgreen}{HTML}{58D68D}
\definecolor{secondyellow}{HTML}{F4D03F}
\definecolor{thirdorange}{HTML}{F39C12}
\definecolor{purple1}{HTML}{D7BDE2}
\definecolor{purple2}{HTML}{BB8FCE}
\definecolor{purple3}{HTML}{A569BD}
\definecolor{purple4}{HTML}{884EA0}
\definecolor{root}{HTML}{B2B2B2}
\usepackage{tikz}
\usepackage{pgfmath}
\usetikzlibrary{decorations.text, arrows.meta,calc,shadows.blur,shadings}
\renewcommand*\familydefault{\sfdefault} % Set font to serif family
\def\arctext[#1][#2][#3](#4)(#5)(#6)#7{

\draw[
color=white,
thick,
line width=1.3pt,
fill=#2
]
(#5:#4cm+#3) coordinate (above #1) arc (#5:#6:#4cm+#3)
-- (#6:#4) coordinate (right #1) -- (#6:#4cm-#3) coordinate (below right #1)
arc (#6:#5:#4cm-#3) coordinate (below #1)
-- (#5:#4) coordinate (left #1) -- cycle;
\def\a#1{#4cm+#3}
\def\b#1{#4cm-#3}
\path[
decoration={
    raise = -0.5ex, % Controls relavite text height position.
    text  along path,
    text = {#7},
    text align = center,
},
decorate
]
(#5:#4) arc (#5:#6:#4);
}

%arcarrow, this is mine, for beerware purpose...
%Function: Draw an arrow from arctex coordinate specific nodes to another
%Arrow start at the start of arctext box and could be shifted to change the position
%to avoid go over another box.
%Var: 1:Start coordinate 2:End coordinate 3:angle to shift from acrtext box
\def\arcarrow[#1](#2)(#3)[#4]{
\draw[thick,-,>=latex,color=#1,line width=1pt,shorten >=-2pt, shorten <=-2pt]
    let \p1 = (#2), \p2 = (#3), % To access cartesian coordinates x, and y.
        \n1 = {veclen(\x1,\y1)}, % Distance from the origin
        \n2 = {veclen(\x2,\y2)}, % Distance from the origin
        \n3 = {atan2(\y1,\x1)} % Angle where acrtext starts.
    in (\n3-#4: \n1) -- (\n3-#4: \n2); % Draw the arrow.
}

\begin{document}
\begin{figure}[h]
    \centering
\begin{tikzpicture}[
    Center/.style ={
        circle,
        fill=white,
        text=root,
        align=center,
        font =\footnotesize,
        inner sep=1pt,
    },
]
% Drawing the center
\node[Center](ROOT) at (0,0) {E};
% Drawing the Tex Arcs
% \Arctext[ID][box-style][box-height](radius)(start-angl)(end-angl){|text-styles| Text}
% Inner ring.
\arctext[N1][firstgreen][15pt](1.5)(90)(-3.6){|\footnotesize\bf\color{white}| 1 26};
\arctext[N2][secondyellow][10pt](1.5)(147.6)(356.4){|\footnotesize\bf\color{white}| 2 58};
\arctext[N3][thirdorange][15pt](1.5)(147.6)(90){|\footnotesize\bf\color{white}| 3 16};
% Outer ring
\arctext[N1S1][purple1][13pt](2.5)(90)(-3.6){|\footnotesize\bf\color{white}| Sub1};
\arctext[N2S4][purple4][13pt](2.5)(147.6)(356.4){|\footnotesize\bf\color{white}| Sub2};
\arctext[N3S1][purple1][13pt](2.5)(147.6)(90){|\footnotesize\bf\color{white}| Sub3};
\end{tikzpicture}
\hspace{2cm}
%%%%%%%%%%%%%%%%%%%%%%%%%%%%%%%%%%%%%%%%%%%%%%%%%%%%%%%%%%%%%%%%%%%%%%
\begin{tikzpicture}[
    Center/.style ={
        circle,
        fill=white,
        text=root,
        align=center,
        font =\footnotesize,
        inner sep=1pt,
    },
]
% Drawing the center
\node[Center](ROOT) at (0,0) {V};
% Drawing the Tex Arcs
% \Arctext[ID][box-style][box-height](radius)(start-angl)(end-angl){|text-styles| Text}
% Inner ring.
\arctext[N1][firstgreen][10pt](1.5)(90)(-68.4){|\footnotesize\bf\color{white}| 1 44};
\arctext[N2][secondyellow][15pt](1.5)(194.4)(291.6){|\footnotesize\bf\color{white}| 2 27};
\arctext[N3][thirdorange][15pt](1.5)(194.4)(90){|\footnotesize\bf\color{white}| 3 29};
% Outer ring
% 1
\arctext[N1S1][purple1][13pt](2.5)(90)(-49.4){};
\arctext[N1S2][purple2][13pt](2.5)(310.6)(307.4){};
\arctext[N1S3][purple3][13pt](2.5)(307.4)(293.2){};
\arctext[N1S4][purple4][13pt](2.5)(293.2)(291.6){};
% 2
\arctext[N2S1][purple1][13pt](2.5)(291.6)(252.7){};
\arctext[N2S2][purple2][13pt](2.5)(252.7)(223.6){};
\arctext[N2S3][purple3][13pt](2.5)(223.6)(215.8){};
\arctext[N2S4][purple4][13pt](2.5)(215.8)(194.4){};
% 3
\arctext[N3S1][purple1][13pt](2.5)(194.4)(175.6){};
\arctext[N3S2][purple2][13pt](2.5)(175.6)(103.6){};
\arctext[N3S3][purple3][13pt](2.5)(103.6)(90){};
\end{tikzpicture}
    \caption{CAPTION}
    \label{fig:my_label}
\end{figure}
\end{document}
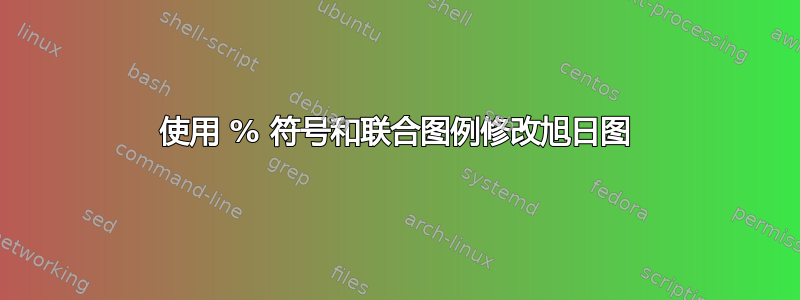
答案1
这轮图我写的包,可以使用。
弧线中的文本由键指定。此文本的方向取决于键中使用的arc data弧线中间的角度。此文本的位置由键决定。\WCmidanglearc data dirarc data pos
切片之间的间隙是通过密钥获得的gap。
图例由键决定legend。这是一个tabular放置在 中的\node。行由键决定legend row。可以使用 获得所有行的结果\WClegend。

\documentclass[border=6pt]{standalone}
\usepackage{wheelchart}
\usetikzlibrary{decorations.text}
\definecolor{firstgreen}{HTML}{58D68D}
\definecolor{secondyellow}{HTML}{F4D03F}
\definecolor{thirdorange}{HTML}{F39C12}
\definecolor{purple1}{HTML}{D7BDE2}
\definecolor{purple2}{HTML}{BB8FCE}
\definecolor{purple3}{HTML}{A569BD}
\definecolor{purple4}{HTML}{884EA0}
\definecolor{root}{HTML}{B2B2B2}
\begin{document}
\begin{tikzpicture}
\sffamily
\pgfkeys{
  /wheelchart,
  arc data dir={\WCmidangle<180?1:-1},
  arc data pos=0.5,
  arc data style={text color=white},
  data=,
  gap=0.65pt/1cm,
  middle style={root,font=\footnotesize}
}
\wheelchart[
  arc data=|\footnotesize\bfseries|\WCvarC{} \WCpercentage{\,}{\%},
  middle=E,
  radius={1.5-\WCvarD pt/1cm}{1.5+\WCvarD pt/1cm}
]{%
  26/firstgreen/1/14.35,
  58/secondyellow/2/9.35,
  16/thirdorange/3/14.35%
}
\wheelchart[
  arc data=|\footnotesize\bfseries|\WCvarC,
  radius={2.5-12.35pt/1cm}{2.5+12.35pt/1cm}
]{%
  26/purple1/Sub1,
  58/purple4/Sub2,
  16/purple1/Sub3%
}
\begin{scope}[shift={(0,-7)}]
\wheelchart[
  arc data=|\footnotesize\bfseries|\WCvarC{} \WCpercentage{\,}{\%},
  legend row={\tikz\fill[\WCvarB] (0,0) rectangle (0.3,0.3); & \WCvarC & \WCperc},
  legend={
    \node[anchor=north] at (0,-4) {%
      \begin{tabular}{lll}
      \WClegend
      \end{tabular}%
    };
  },
  middle=V,
  radius={1.5-\WCvarD pt/1cm}{1.5+\WCvarD pt/1cm}
]{%
  44/firstgreen/1/9.35,
  27/secondyellow/2/14.35,
  29/thirdorange/3/14.35%
}
\wheelchart[
  radius={2.5-12.35pt/1cm}{2.5+12.35pt/1cm}
]{%
  39/purple1,
  0.8/purple2,
  3.9/purple3,
  0.44/purple4,
  10.8/purple1,
  8.08/purple2,
  2.1/purple3,
  5.9/purple4,
  5.2/purple1,
  20/purple2,
  3.78/purple3%
}
\end{scope}
\end{tikzpicture}
\end{document}