

我有大量由 pgfplots 生成的图形,我想将它们包含在figures文件夹中的主文档中。
图形和相应的数据存储在以下结构的文件夹中:
figure
├───data
|     └───data.csv
└───plot
      └───figure.txt
和
% figure.tex

\begin{tikzpicture}
\begin{axis}[]
   \addplot [] table [...] {../data/data.csv};
\end{axis}[]
\end{tikzpicture}
有什么方法可以把这些图包含在主文档中吗main.tex?
parent
├───main.tex
└───figures
    └───figure-1
        ├───data
        |   └───data.csv
        └───plot
            └───figure.txt
如果我使用包subimport中的命令import,子文件中的相对路径figure.tex会导致错误。
我知道讨论使用相对路径导入输入 pgfplots,但未能实施 Christian Feuersänger 的建议。
答案1
评论太长了。
我不能 100% 确定我是否理解了你的问题,但这里有一个我通常如何组织我的内容的例子,效果很好。那就是
- 将 PGFPlots 图表存储在文件夹中
plots - 将 PGFPlots 图表中使用的数据存储在文件夹中
plots/data
(无论来源如何(外部或内部,例如 gnuplot)) - 使用的存储图形
\includegraphics存储在文件夹Pics(或 的子文件夹中Pics)中 - 将 TikZ 和 PGFPlots 的外部图像存储在文件夹中
Pics/pgf-export
只要你愿意写某些内容到同一级别\jobname.tex或更低级别的文件夹,一切都会正常工作(无需使用任何技巧)。
% used PGFPlots v1.16
\begin{filecontents*}{plots/data/WaterDensity.txt}
% density of liquid water at 1 atm
% (from <https://en.wikipedia.org/w/index.php?title=Density&oldid=935683038#Water>)
% °C kg/m3
T rho
0 999.8395
4 999.9720
10 999.7026
15 999.1026
20 998.2071
22 997.7735
25 997.0479
30 995.6502
40 992.2
60 983.2
80 971.8
100 958.4
\end{filecontents*}
\begin{filecontents*}{plots/WaterDensity}
\tikzsetnextfilename{WaterDensity}
\begin{tikzpicture}
\begin{axis}[
xlabel={$T$ / \si{\celsius}},
ylabel={$\rho$ / \si{\kg\per\cubic\metre}},
smooth,
]
\addplot+ [only marks] table [x=T,y=rho] {plots/data/WaterDensity.txt};
% equation (6) from <https://www.ncbi.nlm.nih.gov/pmc/articles/PMC4909168/>
\addplot+ [
domain=0:40,
no markers,
] gnuplot [id=WaterDensity] {
999.84847
+ 6.337563e-2 * x
- 8.523829e-3 * x^2
+ 6.943248e-5 * x^3
- 3.821216e-7 * x^4
};
\pgfplotsset{cycle list shift=-1}
% equation (6) from <https://www.ncbi.nlm.nih.gov/pmc/articles/PMC4909168/>
\addplot+ [
domain=40:100,
no markers,
dashed,
] gnuplot [id=WaterDensityExtrapolated] {
999.84847
+ 6.337563e-2 * x
- 8.523829e-3 * x^2
+ 6.943248e-5 * x^3
- 3.821216e-7 * x^4
};
\end{axis}
\end{tikzpicture}
\end{filecontents*}
\documentclass{article}
\usepackage{siunitx}
\DeclareSIUnit{\atm}{atm}
\usepackage{pgfplots}
\usetikzlibrary{
external,
}
\pgfplotsset{
compat=1.16,
/tikz/font=\small,
/tikz/prefix=plots/data/,
}
\tikzexternalize[
prefix=Pics/pgf-export/,
only named=true, % prevent externalization of none named figures/plots
% force remake, % force all tikz images to be externalized (again)
]
\begin{document}
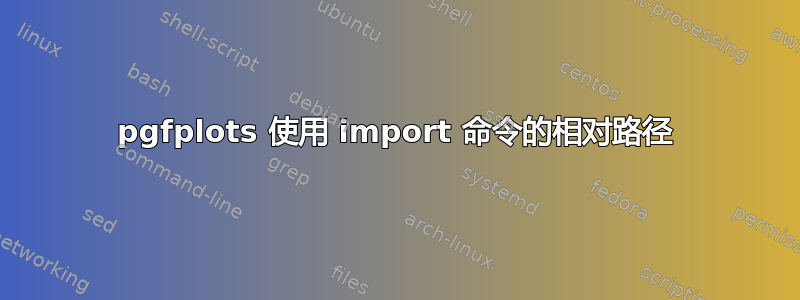
\begin{figure}
\centering
\input{plots/WaterDensity}
\caption{Density of water at \SI{1}{\atm}}
\label{plot:WaterDensity}
\end{figure}
\end{document}
