

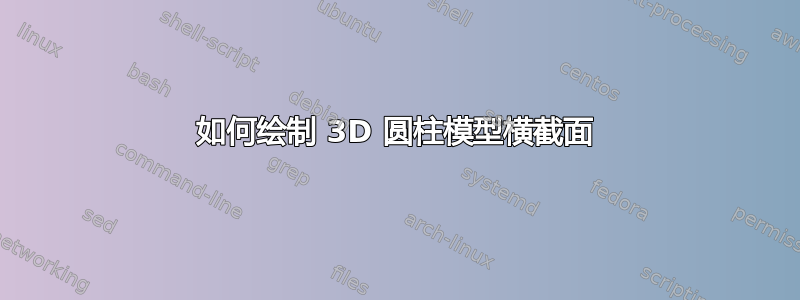
我正在尝试使用 \tikzpicture 绘制我正在处理的模型的横截面等距视图。
下面我附上了一张照片,显示了所需的视图及其尺寸。
如能提供任何帮助我将非常感激:)
(对绘图表示歉意)

答案1
这是给你一个开始。它不是试图完全重绘这幅图。然而,它确实为你提供了大部分内容,其余部分在我看来是重复。
更详细地说,
- 为了安装 3d 视图,需要使用该库。(我认为,只有另外指定圆柱体在 3d 空间中的方向,
perspective该语句才有意义。)isometric view - 长度通过存储在“函数”中
declare function。 - 这是 Ti钾Z,所以我们需要按照适当的顺序绘制各个面。如果你不喜欢这样,请切换到
asymptote。
代码和结果:
\documentclass[tikz,border=3mm]{standalone}
\usetikzlibrary{perspective}
\begin{document}
\begin{tikzpicture}[>=stealth,semithick,line cap=round,
    declare function={R=20;d=9;dd=1.5;rr=5;L=10;l=1;},%<- d/2efine some lengths
    scale=0.15]
 \begin{scope}[3d view={30}{10}]%<- install 3d view and set view angles
  \path[fill=gray!80] plot[variable=\t,domain=60:110,smooth]
     ({R*cos(\t)},{d/2},{R*sin(\t)})
   --   plot[variable=\t,domain=110:60,smooth]
     ({R*cos(\t)},{-d/2},{R*sin(\t)}) -- cycle;
  \path[fill=gray!40] plot[variable=\t,domain=120:240,smooth]
     ({R*cos(\t)},{-d/2},{R*sin(\t)})
      --   plot[variable=\t,domain=240:120,smooth]
     ({rr*cos(\t)},{-d/2},{rr*sin(\t)}) --cycle;
  \path[fill=black]  plot[variable=\t,domain=120:240,smooth]
     ({rr*cos(\t)},{-d/2},{rr*sin(\t)})
     -- ({rr*cos(240)},{d/2},{rr*sin(240)})
     -- ({(rr+dd)*cos(240)},{d/2},{(rr+dd)*sin(240)})
   -- plot[variable=\t,domain=240:120,smooth]
     ({(rr+dd)*cos(\t)},{-d/2},{(rr+dd)*sin(\t)}) -- cycle;
  \path[fill=brown!40] plot[variable=\t,domain=120:60,smooth]
     ({rr*cos(\t)},{d/2+l},{rr*sin(\t)}) --
     plot[variable=\t,domain=60:120,smooth]
     ({rr*cos(\t)},{-d/2-L},{rr*sin(\t)}) --
     cycle;
  \path[fill=gray!40] plot[variable=\t,domain=60:120,smooth]
     ({R*cos(\t)},{-d/2},{R*sin(\t)})
      --   plot[variable=\t,domain=120:60,smooth]
     ({rr*cos(\t)},{-d/2},{rr*sin(\t)}) --cycle;
  \path[fill=black]  plot[variable=\t,domain=120:60,smooth]
     ({rr*cos(\t)},{-d/2},{rr*sin(\t)})
     -- ({rr*cos(60)},{d/2},{rr*sin(60)})
     -- ({(rr+dd)*cos(60)},{d/2},{(rr+dd)*sin(60)})
   -- plot[variable=\t,domain=60:120,smooth]
     ({(rr+dd)*cos(\t)},{-d/2},{(rr+dd)*sin(\t)}) -- cycle;
  \path[fill=gray!60]
    ({(rr+dd)*cos(60)},{-d/2},{(rr+dd)*sin(60)})
    -- ({(rr+dd)*cos(60)},{d/2},{(rr+dd)*sin(60)})
    -- ({R*cos(60)},{d/2},{R*sin(60)})
    -- ({R*cos(60)},{-d/2},{R*sin(60)}) -- cycle;
  \path[fill=brown!60] plot[variable=\t,domain=240:60,smooth]
     ({rr*cos(\t)},{-d/2-L},{rr*sin(\t)}) --cycle;
  \path[fill=brown]
     ({rr*cos(240)},{-d/2-L},{rr*sin(240)})
     -- ({rr*cos(60)},{-d/2-L},{rr*sin(60)})
     -- ({rr*cos(60)},{d/2+l},{rr*sin(60)})
     -- ({rr*cos(240)},{d/2+l},{rr*sin(240)})
     --cycle;
  \path[fill=gray!60]
    ({(rr+dd)*cos(240)},{-d/2},{(rr+dd)*sin(240)})
    -- ({(rr+dd)*cos(240)},{d/2},{(rr+dd)*sin(240)})
    -- ({R*cos(240)},{d/2},{R*sin(240)})
    -- ({R*cos(240)},{-d/2},{R*sin(240)}) -- cycle;
 \end{scope}
 %
 \begin{scope}[xshift=35cm]
  \draw (-d/2,-R) rectangle (d/2,-rr-dd) (-d/2,R) rectangle (d/2,rr+dd)
   (-d/2-L,-rr) rectangle (d/2+l,rr);
  \draw[fill] (-d/2,-rr) rectangle (d/2,-rr-dd)
  (-d/2,rr) rectangle (d/2,rr+dd);
  \draw[dashed] (d/2,R) -- ++ (5,0) coordinate (rt)
     (d/2,-R) -- ++ (5,0) coordinate (rb);
  \draw[<->] (rt) -- (rb) node[midway,rotate=90,anchor=north]
     {\pgfmathparse{2*R}\pgfmathprintnumber\pgfmathresult\,mm};
  \draw[<->] (-d/2,R+1) --  (d/2,R+1) node[midway,rotate=90,anchor=west]
  {\pgfmathparse{d}\pgfmathprintnumber\pgfmathresult\,mm};
 \end{scope}
\end{tikzpicture}
\end{document}
