

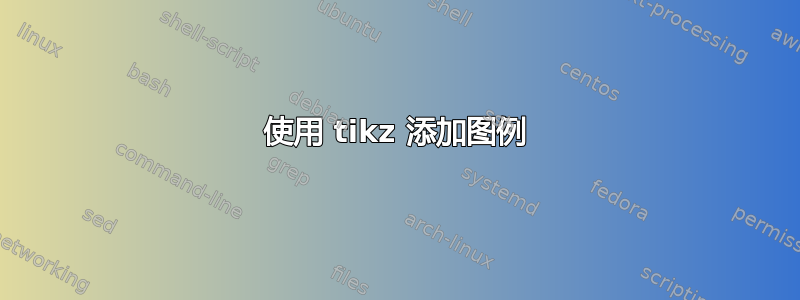
我想将以下文本放在这两个图下方的框中的水平图例中(用相应的形状替换(:) 左侧的文本):
右箭头或下箭头:前进;左箭头或上箭头:上升;自循环:停留;红圈:是;蓝圈:否;半蓝半红圈:两者皆可
怎么做?
\documentclass{article}
\usepackage{tikz}
\usepackage{lipsum}
\usetikzlibrary{automata, backgrounds,calc,shapes}
\usepackage{subfig}
\makeatletter
\tikzset{circle split part fill/.style args={#1,#2}{%
 alias=tmp@name,
  postaction={%
    insert path={
     \pgfextra{%
     \pgfpointdiff{\pgfpointanchor{\pgf@node@name}{center}}%
                  {\pgfpointanchor{\pgf@node@name}{east}}%
     \pgfmathsetmacro\insiderad{\pgf@x}
      \fill[#1] (\pgf@[email protected]) ([xshift=-\pgflinewidth]\pgf@[email protected]) arc
                          (0:180:\insiderad-\pgflinewidth)--cycle;
      \fill[#2] (\pgf@[email protected]) ([xshift=\pgflinewidth]\pgf@[email protected])  arc
                           (180:360:\insiderad-\pgflinewidth)--cycle;            %  \end{scope}
         }}}}}
 \makeatother
\begin{document}
\definecolor{yes}{RGB}{255,51,76}
\definecolor{no}{RGB}{161,251,251}
    \begin{figure}[ht]
    \centering
\tikzset{shorten >=1pt,
        node distance=.55cm,
        font = \tiny,
        auto,%on grid
        state/.style = {shape=circle,thick,draw,minimum width=+1.7ex,minimum height=+1.4ex,inner sep=+.1pt}
        }
  \subfloat[]{\begin{tikzpicture}
    \node[state, fill=gray] (d31) {};
    \node[state,fill=gray,above of=d31] (d21) {};
    \node[state,fill=gray, above of=d21] (d11) {};

    \node[state,fill=gray, right of=d11] (d12) {};
    \node[state,fill=gray,below of=d12] (d22) {};
    \node[state,fill=gray,below of=d22] (d32) {};
    \node[state,fill=gray,below of=d32] (d42) {};
    \node[state,fill=gray,below of=d31] (d41) {};

    \node[state,right of=d12] (d13) {};
    \node[state,right of=d22] (d23) {};
    \node[state,fill=gray,right of=d32] (d33) {};
    \node[state,fill=gray,below of=d33] (d43) {};


    \node[state,right of=d13] (d14) {};
    \node[state,right of=d14] (d15) {};
    \node[state,right of=d23] (d24) {};
    \node[state,fill=no,right of=d24] (d25) {};
   \node[state,fill=gray,right of=d33] (d34) {};
    \node[state,fill=gray,right of=d34] (d35) {};
    \node[state,fill=yes,below of=d34] (d44) {};
    \node[state,right of=d44] (d45) {};

    \path[->,thick] (d25) edge [in=150,out=110,loop] coordinate[pos=0.52] (midp) (d25);
    \path[->,draw,thick]
    (d43) edge node {}(d44);
    \end{tikzpicture}}
        \hspace{.5cm}
    \subfloat[cohort 11]{\begin{tikzpicture}
    \node[state, fill=gray] (d31) {};
    \node[state,fill=gray,above of=d31] (d21) {};
    \node[state,fill=gray, above of=d21] (d11) {};

    \node[state,fill=gray, right of=d11] (d12) {};
    \node[state,fill=gray,below of=d12] (d22) {};
    \node[state,fill=gray,below of=d22] (d32) {};
    \node[state,fill=gray,below of=d32] (d42) {};
    \node[state,fill=gray,below of=d31] (d41) {};

    \node[state,right of=d12] (d13) {};
    \node[state,right of=d22] (d23) {};
    \node[state,fill=gray,right of=d32] (d33) {};
    \node[state,fill=gray,below of=d33] (d43) {};


    \node[state,right of=d13] (d14) {};
    \node[state,right of=d14] (d15) {};
    \node[state,right of=d23] (d24) {};
    \node[state,right of=d24] (d25) {};
   \node[state,fill=gray,right of=d33] (d34) {};
    \node[state,right of=d34] (d35) {};
    \node[state,circle split part fill={no,yes},
    below of=d34] (d44) {};
    \node[state,right of=d44] (d45) {};

    \path[->,draw,thick]
    (d34) edge node {}(d44)
    (d43) edge node {}(d44);
    \end{tikzpicture}}
\caption{my figure}
\end{figure}
\end{document}
答案1
对于图例造成最小损害的建议是使用矩阵。
\documentclass{article}
\usepackage{tikz}
\usetikzlibrary{automata, backgrounds,calc,shapes}
\usepackage{subfig}
\makeatletter
\tikzset{circle split part fill/.style args={#1,#2}{%
 alias=tmp@name,
  postaction={%
    insert path={
     \pgfextra{%
     \pgfpointdiff{\pgfpointanchor{\pgf@node@name}{center}}%
                  {\pgfpointanchor{\pgf@node@name}{east}}%
     \pgfmathsetmacro\insiderad{\pgf@x}
      \fill[#1] (\pgf@[email protected]) ([xshift=-\pgflinewidth]\pgf@[email protected]) arc
                          (0:180:\insiderad-\pgflinewidth)--cycle;
      \fill[#2] (\pgf@[email protected]) ([xshift=\pgflinewidth]\pgf@[email protected])  arc
                           (180:360:\insiderad-\pgflinewidth)--cycle;            %  \end{scope}
         }}}}}
 \makeatother
\begin{document}
\definecolor{yes}{RGB}{255,51,76}
\definecolor{no}{RGB}{161,251,251}
    \begin{figure}[ht]
    \centering
\tikzset{shorten >=1pt,
        node distance=.55cm,
        font = \tiny,
        auto,%on grid
        state/.style = {shape=circle,thick,draw,minimum width=+1.7ex,minimum height=+1.4ex,inner sep=+.1pt}
        }
  \subfloat[]{\begin{tikzpicture}
    \node[state, fill=gray] (d31) {};
    \node[state,fill=gray,above of=d31] (d21) {};
    \node[state,fill=gray, above of=d21] (d11) {};

    \node[state,fill=gray, right of=d11] (d12) {};
    \node[state,fill=gray,below of=d12] (d22) {};
    \node[state,fill=gray,below of=d22] (d32) {};
    \node[state,fill=gray,below of=d32] (d42) {};
    \node[state,fill=gray,below of=d31] (d41) {};

    \node[state,right of=d12] (d13) {};
    \node[state,right of=d22] (d23) {};
    \node[state,fill=gray,right of=d32] (d33) {};
    \node[state,fill=gray,below of=d33] (d43) {};


    \node[state,right of=d13] (d14) {};
    \node[state,right of=d14] (d15) {};
    \node[state,right of=d23] (d24) {};
    \node[state,fill=no,right of=d24] (d25) {};
   \node[state,fill=gray,right of=d33] (d34) {};
    \node[state,fill=gray,right of=d34] (d35) {};
    \node[state,fill=yes,below of=d34] (d44) {};
    \node[state,right of=d44] (d45) {};

    \path[->,thick] (d25) edge [in=150,out=110,loop] coordinate[pos=0.52] (midp) (d25);
    \path[->,draw,thick]
    (d43) edge node {}(d44);
    \end{tikzpicture}}
        \hspace{.5cm}
    \subfloat[cohort 11]{\begin{tikzpicture}
    \node[state, fill=gray] (d31) {};
    \node[state,fill=gray,above of=d31] (d21) {};
    \node[state,fill=gray, above of=d21] (d11) {};

    \node[state,fill=gray, right of=d11] (d12) {};
    \node[state,fill=gray,below of=d12] (d22) {};
    \node[state,fill=gray,below of=d22] (d32) {};
    \node[state,fill=gray,below of=d32] (d42) {};
    \node[state,fill=gray,below of=d31] (d41) {};

    \node[state,right of=d12] (d13) {};
    \node[state,right of=d22] (d23) {};
    \node[state,fill=gray,right of=d32] (d33) {};
    \node[state,fill=gray,below of=d33] (d43) {};


    \node[state,right of=d13] (d14) {};
    \node[state,right of=d14] (d15) {};
    \node[state,right of=d23] (d24) {};
    \node[state,right of=d24] (d25) {};
   \node[state,fill=gray,right of=d33] (d34) {};
    \node[state,right of=d34] (d35) {};
    \node[state,circle split part fill={no,yes},
    below of=d34] (d44) {};
    \node[state,right of=d44] (d45) {};

    \path[->,draw,thick]
    (d34) edge node {}(d44)
    (d43) edge node {}(d44);
    \end{tikzpicture}} \\
\begin{tikzpicture}% note that \tiny gets inherited from above
\matrix[column sep=1ex]{ \draw[->] (-1.2em,1em) -- (-1.2em,0); \draw[->] (-1em,0.5em) -- (0,0.5em)
node[right] {go forward};
 &
 \draw[<-] (-1.2em,1em) -- (-1.2em,0); \draw[<-] (-1em,0.5em) -- (0,0.5em)
node[right] {go up};
& \draw (-0.2em,0)  edge [in=110,out=70,loop] (-0.2em,0);
\path (0,0.5em) node[right] {stay};
& \path (0,0.5em) node[state,fill=yes,label=right:Yes]{};
& \path (0,0.5em) node[state,fill=no,label=right:No]{};
& \path (0,0.5em) node[state,circle split part fill={no,yes},label=right:Both]{};\\
};
\end{tikzpicture}
\caption{my figure}
\end{figure}
\end{document}

然而,如果我是你,我也会将主要图表绘制成矩阵,并\pgfextra用简单的path pictures 来交换内容。
\documentclass{article}
\usepackage{tikz}
\usetikzlibrary{automata,matrix}
\usepackage{subfig}
\begin{document}
\definecolor{yes}{RGB}{255,51,76}
\definecolor{no}{RGB}{161,251,251}
\begin{figure}[ht]
    \centering
\tikzset{semifill/.style 2 args={path picture={
        \fill[#1] (path picture bounding box.west) rectangle
            (path picture bounding box.north east);
        \fill[#2] (path picture bounding box.west) rectangle
            (path picture bounding box.south east);
             }},
        shorten >=1pt,
        node distance=.55cm,
        font = \tiny,
        auto,%on grid
        state/.style = {shape=circle,thick,draw,minimum width=+1.7ex,minimum height=+1.4ex,inner sep=+.1pt}
        }
  \subfloat[]{\begin{tikzpicture}
    \matrix[matrix of nodes,nodes in empty cells,nodes={state},
        column sep=1em,row sep=1em,yshift=4cm,
        column 1/.style={nodes={fill=gray}},
        column 2/.style={nodes={fill=gray}},
        row 3/.style={nodes={fill=gray}},
        row 4/.style={nodes={fill=gray}},
        ampersand replacement=\&] (mat) {
      \& \&  \& \& \\
      \& \& \& \& |[fill=no]|\\
      \& \& \& \& \\
      \& \& \& |[fill=yes]| \& |[fill=white]|\\
     };
    \path[->,thick] (mat-2-5) edge [in=150,out=110,loop] (mat-2-5);
    \draw[->,thick] (mat-4-3) -- (mat-4-4);
    \end{tikzpicture}}
        \hspace{.5cm}
    \subfloat[cohort 11]{\begin{tikzpicture}
    \matrix[matrix of nodes,nodes in empty cells,nodes={state},
        column sep=1em,row sep=1em,
        column 1/.style={nodes={fill=gray}},
        column 2/.style={nodes={fill=gray}},
        row 3/.style={nodes={fill=gray}},
        row 4/.style={nodes={fill=gray}},
        ampersand replacement=\&] (mat) {
      \& \&  \& \& \\
      \& \& \& \& \\
      \& \& \& \&  |[fill=white]|\\
      \& \& \& |[semifill={no}{yes}]| \& |[fill=white]|\\
     };
    \draw[->,thick] (mat-4-3) -- (mat-4-4);
    \draw[->,thick] (mat-3-4) -- (mat-4-4);
    \end{tikzpicture}} \\
\begin{tikzpicture}% note that \tiny gets inherited from above
\matrix[column sep=1ex]{ \draw[->] (-1.2em,1em) -- (-1.2em,0); \draw[->] (-1em,0.5em) -- (0,0.5em)
node[right] {go forward};
 &
 \draw[<-] (-1.2em,1em) -- (-1.2em,0); \draw[<-] (-1em,0.5em) -- (0,0.5em)
node[right] {go up};
& \draw (-0.2em,0)  edge [in=110,out=70,loop] (-0.2em,0);
\path (0,0.5em) node[right] {stay};
& \path (0,0.5em) node[state,fill=yes,label=right:Yes]{};
& \path (0,0.5em) node[state,fill=no,label=right:No]{};
& \path (0,0.5em) node[state,semifill={no}{yes},label=right:Both]{};\\
};
\end{tikzpicture}
\caption{my figure.}
\end{figure}
\end{document}
