

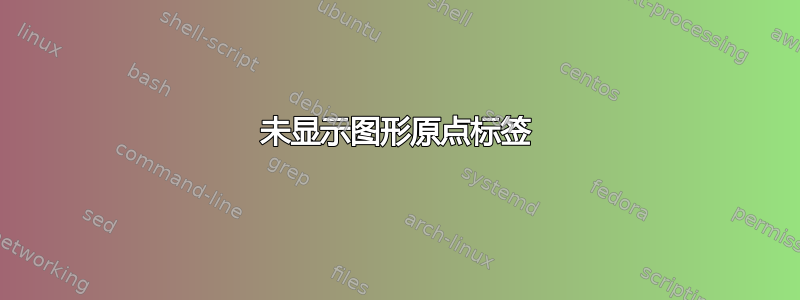
我希望在初始时间输出“12 pm”而不是 0。出于某种原因,0 会覆盖我指定的标签。
我也想将 0 作为初始垂直值,但不确定如何做到这一点。
\documentclass[]{article}
\usepackage[margin=0.5in]{geometry}
\usepackage{pgfplots}
\renewcommand{\thesection}{\arabic{section}}
\usepackage{mathtools}
\usepackage{cancel}
\usepackage{pgfplots}
\newenvironment{tightcenter}{
\setlength\topsep{0pt}
\setlength\parskip{0pt}
\begin{center}}{\end{center}}
\begin{document}
% !TeX spellcheck = en_GB
\text{}\\
\begin{tikzpicture}
\begin{axis}[
axis line style=thick,
axis lines=middle,
grid=major,
%
every x tick/.style={black},
every y tick/.style={black},
%
%grid style={line width=.1pt, draw=black!40},
major grid style={line width=.2pt,draw=black!70},
%
xmin=0,
xmax=21.4,
ymin=0,
ymax=14.5,
xtick={0,2,4,6,8,10,12,14,16,18,20},
xticklabels={$12$ pm,$ $,$2$ pm,$ $,$4$ pm,$ $,$6$ pm,$ $,$8$ pm,$ $,$12$ pm},
ytick={0,2,4,6,8,10,12,14,16,18,20},
height=9cm,
width=16cm,
clip=false,
ylabel style={
    anchor=south,
    at={(ticklabel* cs:1.0)},
    yshift=1pt
},
ylabel=\text{Distance (km)},
xlabel=\text{Time},
%ylabel near ticks,
xlabel near ticks,
%ylabel style={rotate=-90}
]
%\draw[thick]
%(axis cs: 0,0)--
%(axis cs: 8,4)--
%(axis cs: 12,4)--
%(axis cs: 16,12)--
%(axis cs: 20,0)
%;
%\draw[thick,fill=gray!30] (axis cs: 2.5,0) rectangle (axis cs: 5,8);
%\draw[thick,fill=gray!30] (axis cs: 5,0) rectangle (axis cs: 7.5,14);
%\draw[thick,fill=gray!30] (axis cs: 7.5,0) rectangle (axis cs: 10,16);
%\draw[thick,fill=gray!30] (axis cs: 10,0) rectangle (axis cs: 12.5,10);
%\draw[thick,fill=gray!30] (axis cs: 12.5,0) rectangle (axis cs: 15,4);
%
\node[below] at (axis cs:0,-0.11) {$0$};
\end{axis}
\end{tikzpicture}
\end{document}

答案1
首先没有刻度的原因是因为这hide obscured x ticks是默认的true。此外,我建议自动调整刻度。
\documentclass[]{article}
\usepackage[margin=0.5in]{geometry}
\usepackage{pgfplots}
\pgfplotsset{compat=1.16}
\usepackage{mathtools}
\begin{document}
% !TeX spellcheck = en_GB
\begin{tikzpicture}
\begin{axis}[
axis line style=thick,
axis lines=middle,
grid=major,
%
every x tick/.style={black},
every y tick/.style={black},
%
%grid style={line width=.1pt, draw=black!40},
major grid style={line width=.2pt,draw=black!70},
%
xmin=0,
xmax=21.4,
ymin=0,
ymax=14.5,
ytick={0,2,4,6,8,10,12,14,16,18,20},
xtick={0,2,4,6,8,10,12,14,16,18,20},
xticklabel={
\pgfmathtruncatemacro{\itest}{isodd(\tick/2)}
\ifnum\itest=0
\pgfmathtruncatemacro{\itest}{\tick}
\ifnum\itest=0
12~pm%
\else
\pgfmathprintnumber\tick~pm%
\fi
\fi},
hide obscured x ticks=false,
height=9cm,
width=16cm,
clip=false,
ylabel style={
    anchor=south,
    at={(ticklabel* cs:1.0)},
    yshift=1pt
},
ylabel=\text{Distance (km)},
xlabel=\text{Time},
%ylabel near ticks,
xlabel near ticks,
%ylabel style={rotate=-90}
]
%\draw[thick]
%(axis cs: 0,0)--
%(axis cs: 8,4)--
%(axis cs: 12,4)--
%(axis cs: 16,12)--
%(axis cs: 20,0)
%;
%\draw[thick,fill=gray!30] (axis cs: 2.5,0) rectangle (axis cs: 5,8);
%\draw[thick,fill=gray!30] (axis cs: 5,0) rectangle (axis cs: 7.5,14);
%\draw[thick,fill=gray!30] (axis cs: 7.5,0) rectangle (axis cs: 10,16);
%\draw[thick,fill=gray!30] (axis cs: 10,0) rectangle (axis cs: 12.5,10);
%\draw[thick,fill=gray!30] (axis cs: 12.5,0) rectangle (axis cs: 15,4);
%
%\node[below] at (axis cs:0,-0.11) {$0$};
\end{axis}
\end{tikzpicture}
\end{document}
