

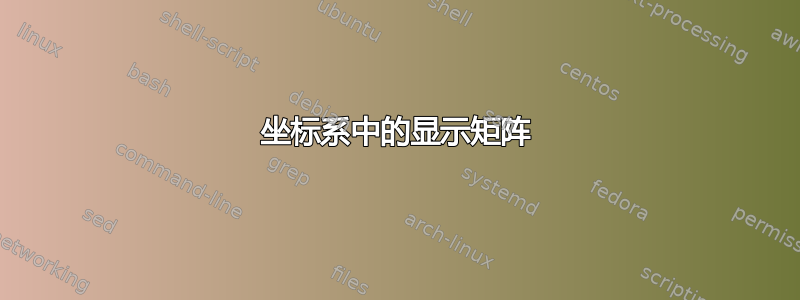
我正在寻找在 2D 坐标系中显示四个文本象限的可能性。实际上它是一个带有标签的 2x2 矩阵。
我希望得到的图形如下所示:

我猜测使用 tkiz 可以轻松实现这一点。
答案1
每一个第一个问题都应该得到帮助。希望你能在下一个问题中发布 MWE。代码是不言自明的。

\documentclass[tikz,border=5mm]{standalone}
\begin{document}
\begin{tikzpicture}
[cell/.style={draw=teal,fill=teal!50,minimum width=2cm,minimum height=1.5cm,rounded corners=2mm,font=\sffamily\bfseries}]
\def\a{1.5}
\def\b{1}
\path
(\a,\b) node[cell]{Swift}
(\a,-\b) node[cell]{Java} +(-90:1.3) node{high}
(-\a,\b) node[cell]{F\#} +(180:1.8) node[rotate=90]{high}
(-\a,-\b) node[cell]{Fortran} +(-90:1.3) node{low} +(180:1.8) node[rotate=90]{low}
;
\draw[dashed] (2*\a,0)--(-2*\a,0) (0,2*\b)--(0,-2*\b);
\draw[-latex] (-2*\a,-2*\b)--+(0:4.25*\a);
\draw[-latex] (-2*\a,-2*\b)--+(90:4.25*\b);
\path
(0,-2.8) node{\bfseries Popularity of language}
(-4,0) node[rotate=90]{\bfseries Newness of language}
;
\end{tikzpicture}
\end{document}
答案2
虽然你绝对不应该问“帮我做”的问题,也不应该在自己搜索如何制作这样的图形后提出一些你在编码时遇到的抽象问题,但我想用这个例子练习一下。这绝对不是最佳的,可以改进:
\documentclass{standalone}

\usepackage{tikz}
    \usetikzlibrary{calc}
    \usetikzlibrary{arrows.meta}

\begin{document}

    \begin{tikzpicture}

        \tikzset{%
            language block/.style = {%
                rectangle,
                draw = blue,
                fill = blue!50!white,
                rounded corners,
                minimum width = 2cm,
                minimum height = 1cm
            }
        }

        \node[
            matrix,
            column sep = 0.5cm,
            row sep = 0.25cm,
        ] (graphmat) {
            \node[language block] (fs) {F\#}; & \node[language block] (s) {Swift};\\
            \node[language block] (f) {Fortran}; & \node[language block] (j) {Java};\\
        };

        \draw[Latex-Latex] (graphmat.north west) |- (graphmat.south east);

        \coordinate (highbottom) at ($(graphmat.south west)!0.75!(graphmat.south east)$);
        \coordinate (lowbottom) at ($(graphmat.south west)!0.25!(graphmat.south east)$);

        \coordinate (highleft) at ($(graphmat.south west)!0.75!(graphmat.north west)$);
        \coordinate (lowleft) at ($(graphmat.south west)!0.25!(graphmat.north west)$);

        \node[below] (hbtext) at (highbottom) {high};
        \node[below] (lbtext) at (lowbottom) {low};

        \node[
            above,
            rotate = 90
        ] (hltext) at (highleft) {high};
        \node[
            above,
            rotate = 90
        ] (lltext) at (lowleft) {low};

        \coordinate (pop) at ($(lbtext)!0.5!(hbtext)$);
        \node[below] at ([yshift = -0.2cm] pop) {\textbf{Popularity of language}};

        \coordinate (new) at ($(lltext)!0.5!(hltext)$);
        \node[
            above,
            rotate = 90
        ] at ([xshift = -0.2cm] new) {\textbf{Newness of language}};

        \draw[dashed] (graphmat.south) -- (graphmat.north);
        \draw[dashed] (graphmat.west) -- (graphmat.east);

    \end{tikzpicture}

\end{document}
得出的结果是:

答案3
只是为了好玩,使用一个解决方案matrix来分配内部节点并作为所有附加线和标签的参考。
\documentclass[tikz, border=2mm]{standalone}
\usetikzlibrary{arrows.meta, matrix}
\usepackage{lmodern}

\begin{document}
\begin{tikzpicture}[font=\sffamily, >=LaTeX]
\matrix (lang) [matrix of nodes, column sep=3mm, row sep=3mm,
    nodes={anchor=center, minimum width=3cm, minimum height=2cm, rounded corners=3mm,
        fill=cyan!90!black, draw=cyan!50!black, line width=.5mm}]
{F\# & Swift \\
Fortran & Java \\};
\draw [->, shorten >=-3mm](lang.south west)--(lang.south east);
\node[below] at (lang.south-|lang-1-1.center) {low};
\node[below] at (lang.south-|lang-1-2.center) {high};
\draw [->, shorten >=-3mm](lang.south west)--(lang.north west);
\node[rotate=90, above] at (lang.west|-lang-2-1.center) {low};
\node[rotate=90, above] at (lang.west|-lang-1-1.center) {high};
\draw[dashed] (lang.south) node[below=5mm, font=\bfseries\sffamily]{Popularity of language}--(lang.north);
\draw[dashed] (lang.west) node[rotate=90, above=5mm, font=\bfseries\sffamily]{Newness of language} --(lang.east);
%\node
\end{tikzpicture}
\end{document}
