

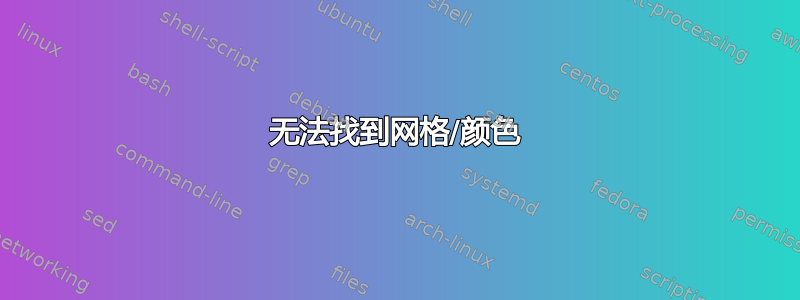
我该如何开始为网格框上色?我想画下面的图。

我尝试过以下方法。很难猜出节点号。
\documentclass{article}
\usepackage{tikz}
\usepackage{subcaption}
\begin{document}

\begin{figure}
\centering
\captionsetup[subfigure]{skip=0pt} % to reduce space above subcaption
\begin{tikzpicture}

\draw[step=1cm,gray,very thin] (-2,-2) grid (2,2);
\node at (0,1,1) {6};
\node at (0,1,4) {6};

\end{tikzpicture}
\caption{stuff}
\end{figure}
\end{document}

答案1
我不知道您说的“猜测节点编号”是什么意思。您在这里以 2D 形式工作,因此所有坐标都应仅用两个数字给出(x,y)。在这里,我从左下角开始 4 x 4 网格(0,0)- 其余一切都自然而然地发生:
\documentclass{article}
\usepackage{tikz}
\begin{document}
\begin{tikzpicture}
\fill[yellow!20] (0,0) rectangle (2,2);
\fill[red!20] (0,2) rectangle (2,4);
%...
\draw[gray,very thin] (0,0) grid (4,4);
\node at (0.5,0.5) {1};
\node at (1.5,0.5) {2};
\node at (2.5,0.5) {3};
\node at (3.5,0.5) {4};
\node at (0.5,1.5) {3};
%...
\draw[-stealth,ultra thick] (5,2) --node[above] {max pool} (7,2);
\draw[gray,very thin] (8,1) grid (10,3);
\end{tikzpicture}
\end{document}

答案2
网格着色和放置数据的操作部分如下--
{
\fill[yellow!20] (0,0) rectangle (2,2);%<----- the 0,0 corresponds to the coordinate
                                               %system on the grid itself and 2,2 is
                                               %the right upper corner of the
                                               %rectangle
%The green!20 says 20% green mixed with white color
%Bonus you can now create circles at any desired location also
%Since each step is 1cm the circle radius as 1cm with red fill at coordinate 3,2

\fill[red!20] (3,2) circle (1cm);
\fill[green]     (-2,-2) rectangle (0,0);
\fill[blue!20]   (-2,0) rectangle (0,2);
\node at         (0.5,0.5) {1};
\node at         (-0.5,-0.5) {4};
}
现在,可以使用@AndrewStacey 在 --- 创建的出色序言,轻松地从网格本身读取网格坐标
https://tex.stackexchange.com/a/39698/197451
我认为这是写来吓唬成员的!!
您可以将其与 @hpekristiansen 的出色回答结合起来,以连接右侧网格

\documentclass{article}
%\url{}
\usepackage{tikz}
\usetikzlibrary{arrows, fit, matrix, positioning, shapes, backgrounds,}

\makeatletter
\def\grd@save@target#1{%
    \def\grd@target{#1}}
\def\grd@save@start#1{%
    \def\grd@start{#1}}
\tikzset{
    grid with coordinates/.style={
        to path={%
            \pgfextra{%
                \edef\grd@@target{(\tikztotarget)}%
                \tikz@scan@one@point\grd@save@target\grd@@target\relax
                \edef\grd@@start{(\tikztostart)}%
                \tikz@scan@one@point\grd@save@start\grd@@start\relax
                \draw[minor help lines] (\tikztostart) grid (\tikztotarget);
                \draw[major help lines] (\tikztostart) grid (\tikztotarget);
                \grd@start
                \pgfmathsetmacro{\grd@xa}{\the\pgf@x/1cm}
                \pgfmathsetmacro{\grd@ya}{\the\pgf@y/1cm}
                \grd@target
                \pgfmathsetmacro{\grd@xb}{\the\pgf@x/1cm}
                \pgfmathsetmacro{\grd@yb}{\the\pgf@y/1cm}
                \pgfmathsetmacro{\grd@xc}{\grd@xa + \pgfkeysvalueof{/tikz/grid with coordinates/major step}}
                \pgfmathsetmacro{\grd@yc}{\grd@ya + \pgfkeysvalueof{/tikz/grid with coordinates/major step}}
                \foreach \x in {\grd@xa,\grd@xc,...,\grd@xb}
                \node[anchor=north] at (\x,\grd@ya) {\pgfmathprintnumber{\x}};
                \foreach \y in {\grd@ya,\grd@yc,...,\grd@yb}
                \node[anchor=east] at (\grd@xa,\y) {\pgfmathprintnumber{\y}};
            }
        }
    },
    minor help lines/.style={
        help lines,
        step=\pgfkeysvalueof{/tikz/grid with coordinates/minor step}
    },
    major help lines/.style={
        help lines,
        line width=\pgfkeysvalueof{/tikz/grid with coordinates/major line width},
        step=\pgfkeysvalueof{/tikz/grid with coordinates/major step}
    },
    grid with coordinates/.cd,
    minor step/.initial=.2,
    major step/.initial=1,
    major line width/.initial=2pt,
}
\makeatother
\begin{document}
    \begin{tikzpicture}
    \draw[help lines,step=1cm] (-2,-2) grid (7,4);
    \draw[help lines,line width=.6pt,step=1] (-2,-2) grid (7,4);
    \foreach \x in {-2,-1,0,1,2,3,4,5,6,7}
    \node[anchor=north] at (\x,-2) {\x};
    \foreach \y in {-2,-1,0,1,2,3,4}
    \node[anchor=east] at (-2,\y) {\y};
    \scoped[on background layer]
{
\fill[yellow!20] (0,0) rectangle (2,2);
\fill[red!20] (3,2) circle (1cm);
\fill[green] (-2,-2) rectangle (0,0);
\fill[blue!20] (-2,0) rectangle (0,2);
\node at (0.5,0.5) {1};
\node at (-0.5,-0.5) {4};
}
    \end{tikzpicture}
%
%   \begin{tikzpicture}
%   \draw (-2,-2) to[grid with coordinates] (7,4);
%   \end{tikzpicture}
\end{document}
答案3
您可以使用matrix节点代替网格:
\documentclass[tikz, border=2mm]{standalone}

\usetikzlibrary{matrix, positioning, arrows.meta}


\begin{document}

\begin{tikzpicture}

\matrix[matrix of nodes,
    column sep=-\pgflinewidth,
    row sep=-\pgflinewidth,
    nodes={anchor=center, minimum size=8mm, fill=red!30, draw}] (LeftMatrix)
{1 & 1 &|[fill=green!30]| 2 &|[fill=green!30]| 4\\
5 & 6 &|[fill=green!30]| 7 &|[fill=green!30]| 8 \\
|[fill=yellow!30]|3 &|[fill=yellow!30]| 2 &|[fill=blue!30]| 1 &|[fill=blue!30]| 0 \\
|[fill=yellow!30]|1 &|[fill=yellow!30]| 2 &|[fill=blue!30]| 3 &|[fill=blue!30]| 4 \\};
 \draw[-{LaTeX}] ([xshift=2mm]LeftMatrix.east) -- node[above, align=left, font=\sffamily\small] {max pool with 2x2 filters\\ and stride 2} ++(0:4cm) coordinate(aux);
\matrix[matrix of nodes,
    column sep=-\pgflinewidth,
    row sep=-\pgflinewidth,
    nodes={anchor=center, minimum size=8mm, fill=red!30, draw}, right=5mm of aux] (RightMatrix)
{6 & |[fill=green!30]| 8\\
|[fill=yellow!30]| 3 & |[fill=blue!30]| 4 \\};


\end{tikzpicture}
\end{document}
