

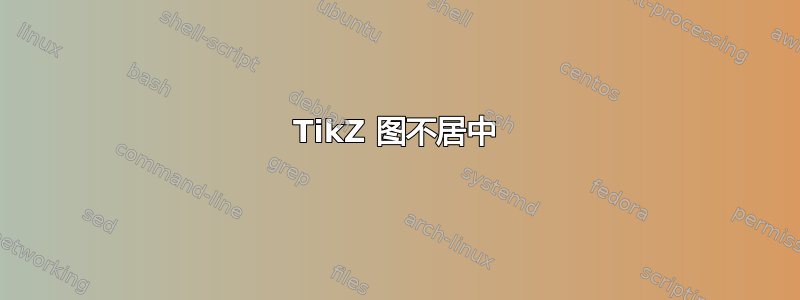
我使用以下内容来展示过度拟合、欠拟合和平衡的例子:
\documentclass[12pt,a4paper,oneside]{book}

\usepackage{tikz}
\usetikzlibrary{positioning, decorations.text, calc}
\usepackage{lipsum}

\begin{document}
\lipsum[1]

\begin{figure}[!ht]
\centering
\begin{tikzpicture}[declare function={f(\x)=0.5*pow(abs(\x-2),2)-0.06*pow(\x-2,3);}]
 \foreach \Z in {1,...,42}
 {\pgfmathsetmacro{\X}{\Z/10}
 \pgfmathsetmacro{\Y}{f(\X)+0.9*rnd}
 \ifnum\Z=1
  \xdef\LstOne{(\X,\Y)}
  \xdef\LstTwo{"(\X,\Y)"}
 \else
  \xdef\LstOne{\LstOne (\X,\Y)}
  \xdef\LstTwo{\LstTwo,"(\X,\Y)"}
 \fi}
 \begin{scope}[local bounding box=over,xshift=-10cm]
 \foreach \Z in {1,...,40}
 {\pgfmathsetmacro{\Last}{{\LstTwo}[\Z-1]}
 \pgfmathsetmacro{\Current}{{\LstTwo}[\Z]}
 \pgfmathsetmacro{\Next}{{\LstTwo}[\Z+1]}
  \edef\temp{\noexpand\path ($0.6*\Current+0.2*\Last+0.2*\Next$)   coordinate   (p\Z);}
  \temp
  \ifnum\Z=1
  \xdef\LstThree{(p\Z)}
  \else
  \xdef\LstThree{\LstThree (p\Z)}
  \fi}
 \foreach \Z in {1,...,42}
 {\pgfmathsetmacro{\Coor}{{\LstTwo}[\Z-1]}
 \fill \Coor circle[radius=1pt];}
 \draw[thick,blue] plot[smooth] coordinates \LstThree;
 \end{scope}
 %
 \begin{scope}[local bounding box=under,xshift=-15cm]
 \foreach \Z in {1,...,42}
 {\pgfmathsetmacro{\Coor}{{\LstTwo}[\Z-1]}
 \fill \Coor circle[radius=1pt];}
 \draw[thick,blue] (0.1,0.4) -- (4.2,2);
 \end{scope}
 %
 \begin{scope}[local bounding box=good,xshift=-5cm]
 \foreach \Z in {1,...,42}
 {\pgfmathsetmacro{\Coor}{{\LstTwo}[\Z-1]}
 \fill \Coor circle[radius=1pt];}
 \draw[thick,blue] plot[smooth,domain=0.1:4.2,variable=\x] (\x,{f(\x)+0.45});
 \end{scope}
 %
 \foreach \X in {over,good,under}
 {\draw[gray,thin] ([xshift=-3pt,yshift=3pt]\X.north west) rectangle  ([xshift=3pt,yshift=-3pt]\X.south east);
  \draw[stealth-stealth,thick] ([xshift=-3pt,yshift=3pt]\X.north west) node{} |- ([xshift=3pt,yshift=-3pt]\X.south east);}
\end{tikzpicture}
\begin{minipage}{0.32\textwidth}\centering
\caption{Underfitting}\label{fig:underfitting}
\end{minipage}
\begin{minipage}{0.32\textwidth}\centering
\caption{Overfitting}\label{fig:overfitting}
\end{minipage}
\begin{minipage}{0.32\textwidth}\centering
\caption{Balance}\label{fig:balance}
\end{minipage}
\end{figure}

\lipsum[1]
\end{document}
得出以下结果:

我怎样才能对齐图表,使它们每个恰好占据文本宽度的 1/3,并且标题位于它们下方中央,而图表和标题之间有跳跃?
答案1
单个范围不是太大,但把它们都放在一个 tikzpicture 中并不是一个好主意。可以在 tikzpicture 环境之外(但在图形内部)进行通用定义。
我确实必须拆分生成轴的循环。局部边界框不会全局保存。
\documentclass[12pt,a4paper,oneside]{book}

\usepackage{tikz}
\usetikzlibrary{positioning, decorations.text, calc}
\usepackage{lipsum}

\begin{document}
\lipsum[1]

\begin{figure}[!ht]
\centering
 \tikzset{declare function={f(\x)=(-0.06*(\x-2)+0.5)*(\x-2)*(\x-2);}}% applied math style
 \foreach \Z in {1,...,42} {\pgfmathsetmacro{\X}{\Z/10}%
 \pgfmathsetmacro{\Y}{f(\X)+0.9*rnd}%
 \ifnum\Z=1
  \xdef\LstOne{(\X,\Y)}%
  \xdef\LstTwo{"(\X,\Y)"}%
 \else
  \xdef\LstOne{\LstOne (\X,\Y)}%
  \xdef\LstTwo{\LstTwo,"(\X,\Y)"}%
 \fi}%
%%%%%%%%%%%%%%%%%%%%%%%%%%%%%%%%%%%%%%%%%%%%%%%%%%%%%%%%%%%%%%%%%%%%%%%%%%%%%%%%%%%
\begin{minipage}[b]{0.32\textwidth}\centering
\begin{tikzpicture}
 \begin{scope}[local bounding box=over]
 \foreach \Z in {1,...,40}
 {\pgfmathsetmacro{\Last}{{\LstTwo}[\Z-1]}
 \pgfmathsetmacro{\Current}{{\LstTwo}[\Z]}
 \pgfmathsetmacro{\Next}{{\LstTwo}[\Z+1]}
  \edef\temp{\noexpand\path ($0.6*\Current+0.2*\Last+0.2*\Next$)   coordinate   (p\Z);}
  \temp
  \ifnum\Z=1
  \xdef\LstThree{(p\Z)}
  \else
  \xdef\LstThree{\LstThree (p\Z)}
  \fi}
 \foreach \Z in {1,...,42}
 {\pgfmathsetmacro{\Coor}{{\LstTwo}[\Z-1]}
 \fill \Coor circle[radius=1pt];}
 \draw[thick,blue] plot[smooth] coordinates \LstThree;
 \end{scope}
 \draw[gray,thin] ([xshift=-3pt,yshift=3pt]over.north west) rectangle  ([xshift=3pt,yshift=-3pt]over.south east);
 \draw[stealth-stealth,thick] ([xshift=-3pt,yshift=3pt]over.north west) |- ([xshift=3pt,yshift=-3pt]over.south east);
 %\draw[red] (current bounding box.south west) rectangle (current bounding box.north east);
\end{tikzpicture}
\caption{Overfitting}\label{fig:overfitting}
\end{minipage}\hfil
%%%%%%%%%%%%%%%%%%%%%%%%%%%%%%%%%%%%%%%%%%%%%%%%%%%%%%%%%%%%%%%%%%%%%%%%%%%%%%%%
\begin{minipage}[b]{0.32\textwidth}\centering
\begin{tikzpicture}
 \begin{scope}[local bounding box=under]
 \foreach \Z in {1,...,42}
 {\pgfmathsetmacro{\Coor}{{\LstTwo}[\Z-1]}
 \fill \Coor circle[radius=1pt];}
 \draw[thick,blue] (0.1,0.4) -- (4.2,2);
 \end{scope}
 \draw[gray,thin] ([xshift=-3pt,yshift=3pt]under.north west) rectangle  ([xshift=3pt,yshift=-3pt]under.south east);
 \draw[stealth-stealth,thick] ([xshift=-3pt,yshift=3pt]under.north west) |- ([xshift=3pt,yshift=-3pt]under.south east);
\end{tikzpicture}
\caption{Underfitting}\label{fig:underfitting}
\end{minipage}\hfil
%%%%%%%%%%%%%%%%%%%%%%%%%%%%%%%%%%%%%%%%%%%%%%%%%%%%%%%%%%%%%%%%%%%%%%%%%%%
\begin{minipage}[b]{0.32\textwidth}\centering
\begin{tikzpicture}
 \begin{scope}[local bounding box=good]
 \foreach \Z in {1,...,42}
 {\pgfmathsetmacro{\Coor}{{\LstTwo}[\Z-1]}
 \fill \Coor circle[radius=1pt];}
 \draw[thick,blue] plot[smooth,domain=0.1:4.2,variable=\x] (\x,{f(\x)+0.45});
 \end{scope}
 \draw[gray,thin] ([xshift=-3pt,yshift=3pt]good.north west) rectangle  ([xshift=3pt,yshift=-3pt]good.south east);
 \draw[stealth-stealth,thick] ([xshift=-3pt,yshift=3pt]good.north west) |- ([xshift=3pt,yshift=-3pt]good.south east);
\end{tikzpicture}
\caption{Balance}\label{fig:balance}
\end{minipage}
\end{figure}

\lipsum[1]
\end{document}
