

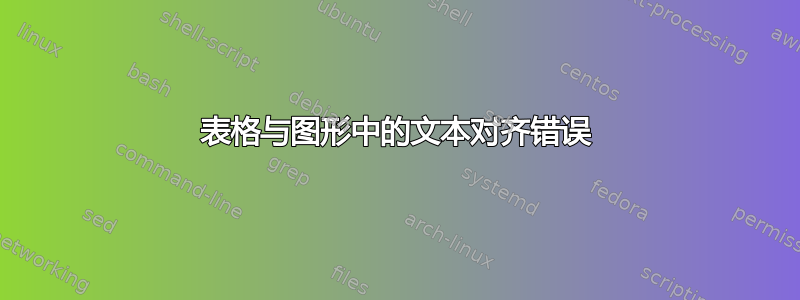
这张图很能说明问题:

为什么文本最终会出现在图形下方?我尝试过多种方法将其对齐到顶部,但每个指南都默认将其对齐到顶部...
这是我的代码:
\documentclass[12pt, letterpaper, twoside]{article}
\usepackage{tikz}
\usetikzlibrary{shapes.geometric, arrows}

\begin{document}
    \tikzstyle{startstop} = [rectangle, rounded corners, minimum width=3cm, minimum height=1cm,text centered, draw=black, fill=red!30]
    \tikzstyle{io} = [trapezium, trapezium left angle=70, trapezium right angle=110, minimum width=3cm, minimum height=1cm, text centered, draw=black, fill=blue!30]
    \tikzstyle{process} = [rectangle, minimum width=3cm, minimum height=1cm, text centered, draw=black, fill=orange!30]
    \tikzstyle{decision} = [diamond, minimum width=3cm, minimum height=1cm, text centered, draw=black, fill=green!30]
    \tikzstyle{arrow} = [thick,->,>=stealth]
    \subsection{Flowchart}
    \begin{tabular}{ |p{6cm}|p{6cm}|  }
        \hline
        Algorithm & Flowchart\\
        \hline
        Stuff

        more

        stuff
        &
        \begin{tikzpicture}[node distance=2cm]
        \node (start) [startstop] {Start};
        \node (in1) [io, below of=start] {Input};
        \node (pro1) [process, below of=in1] {Loop start};
        \node (pro2) [process, below of=pro1] {Process 1};
        \node (pro3) [process, below of=pro2] {Process 1};
        \node (dec1) [decision, below of=pro3] {Decision 1};

        \draw [arrow] (start) -- (in1);
        \draw [arrow] (in1) -- (pro1);
        \draw [arrow] (pro1) -- (pro2);
        \draw [arrow] (pro2) -- (pro3);
        \draw [arrow] (pro3) -- (dec1);

        \draw [arrow] (dec1) -- node[anchor=north] {Yes} ([xshift=7mm] dec1.east) -- ([xshift=7mm] pro1.east) -- (pro1);
        \end{tikzpicture} \\
        \hline
    \end{tabular}
\end{document}
我该如何解决这个问题?我只想让它变得可读。谢谢
答案1
通过添加baseline=(current bounding box.north)的选项tikzpicture,您可以将其基线从默认的底部边缘移至顶部边缘。然而,这将导致 tikzpicture 的顶部与第一行文本的底部垂直对齐:

为了解决这个问题,我使用 测量了字母 S 的高度,\settoheight{\mylength}{S}并将该值存储在 中\mylength。我们现在可以使用baseline={([yshift=-\mylength]current bounding box.north)}将 的基线tkizpicture向下移动字母 S 的高度,从而使 的顶部边缘tikzpicture与左列第一行文本的顶部垂直对齐:

这是完整的 MWE,其中我也尽力摆脱了弃用\tikzstyle和重复的设置(我使用了一种新的common风格)
\documentclass[12pt, letterpaper, twoside]{article}
\usepackage{tikz}
\usetikzlibrary{shapes.geometric, arrows.meta}


\tikzset{common/.style=     {minimum width=3cm,
                             minimum height=1cm,
                             text centered,
                             draw=black},
         startstop/.style = {common,
                             rectangle,
                             rounded corners,
                             fill=red!30},
         io/.style =        {common,
                             trapezium,
                             trapezium left angle=70,
                             trapezium right angle=110,
                             rounded corners,
                             fill=blue!30},
          process/.style =  {common,
                             rectangle,
                             fill=orange!30},
          decision/.style = {common,
                             diamond,
                             fill=green!30},
          arrow/.style=     {thick,
                             ->,
                             >=stealth}
          }

\newlength{\mylength}
\settoheight{\mylength}{S}

\begin{document}
    \subsection{Flowchart}
    \begin{tabular}{ |p{6cm}|p{6cm}|  }
        \hline
        Algorithm & Flowchart\\
        \hline
        Stuff

        more

        stuff
        &
        \begin{tikzpicture}[node distance=2cm, baseline={([yshift=-\mylength]current bounding box.north)}]
        \node (start) [startstop] {Start};
        \node (in1) [io, below of=start] {Input};
        \node (pro1) [process, below of=in1] {Loop start};
        \node (pro2) [process, below of=pro1] {Process 1};
        \node (pro3) [process, below of=pro2] {Process 1};
        \node (dec1) [decision, below of=pro3] {Decision 1};

        \draw [arrow] (start) -- (in1);
        \draw [arrow] (in1) -- (pro1);
        \draw [arrow] (pro1) -- (pro2);
        \draw [arrow] (pro2) -- (pro3);
        \draw [arrow] (pro3) -- (dec1);

        \draw [arrow] (dec1) -- node[anchor=north] {Yes} ([xshift=7mm] dec1.east) -- ([xshift=7mm] pro1.east) -- (pro1);
        \end{tikzpicture} \\
        \hline
    \end{tabular}
\end{document}

答案2
使用我之前对您问题和表格环境的回答。对于算法和流程图在顶部单元格的对齐,只需添加选项tabularx即可。baselinetikzpicture
在下面的 MWE 中添加了makacell用于在单元格内容周围添加垂直空间以及用于\thead列标题的命令的包:
\documentclass[12pt, letterpaper, twoside]{article}
\usepackage{tikz}
\usetikzlibrary{arrows.meta,
                chains,
                positioning,
                quotes,
                shapes.geometric}
\usepackage{makecell, tabularx}
\renewcommand\theadfont{\bfseries}
\renewcommand\theadgape{}
\newcolumntype{C}{>{\centering\arraybackslash}X}
\newcolumntype{L}{>{\raggedright\arraybackslash}X}

\usepackage{lipsum} % for generating dummy text

\begin{document}
    \begin{table}[ht]
    \setcellgapes{5pt}
    \makegapedcells
\begin{tabularx}{\linewidth}{ |L|C|  }
    \hline
\thead{Algorithm}
            &   \thead{Flowchart}           \\
    \hline
\lipsum[66] &   \begin{tikzpicture}[baseline, % <---
            node distance = 6mm and 18mm,
              start chain = A going below,
        %
           arr/.style = {-Straight Barb, semithick},
          base/.style = {draw, minimum width=32mm, minimum height=8mm,
                         align=center, on chain=A, join=by arr},
        startstop/.style = {base, rounded corners, fill=red!30},   % <---
          process/.style = {base, fill=orange!30},                 % <---
               io/.style = {base, trapezium, trapezium stretches body,
                            trapezium left angle=70, trapezium right angle=110,
                            fill=blue!30},
         decision/.style = {base, diamond, fill=green!30},
        every edge quotes/.style = {auto=right, font=\small}
                            ]
        \node [startstop]       {input};            % <-- A-1
        \node [process]         {Loop start};
        \node [process]         {1};
        \node [process]         {2};
        \node [decision]        {Yes or No ?};
        \node [startstop]       {Stop};              % <-- A-6
        %%
        \draw[arr]  (A-5.west)  to ["No"] ++ (-1.8,0) |- (A-2);
        \path       (A-5)       to ["Yes"]  (A-6);
                    \end{tikzpicture}       \\
    \hline
\end{tabularx}
    \end{table}
\end{document}
