

数学家协会
\documentclass{scrartcl}

\usepackage[utf8]{inputenc}
\usepackage[T1]{fontenc}

\usepackage{tikz}

\usetikzlibrary{arrows}
\usetikzlibrary{calc}

\tikzset{> = stealth'}

\tikzset{%
  /tikz/flowchart/.style       = {text height = height("A"), text depth = depth("g"), row sep = 5ex},
  /tikz/flowchart/begin/.style = {flowchart, draw, rectangle, rounded corners = .5em},
  /tikz/flowchart/cmd/.style   = {flowchart, draw, rectangle},
  /tikz/flowchart/cond/.style  = {flowchart, draw, diamond, aspect = 2.7},
  /tikz/flowchart/end/.style   = {flowchart, draw, rectangle, rounded corners = .5em},
  /tikz/flowchart/io/.style    = {flowchart, draw, trapezium, trapezium left angle = 60,  trapezium right angle = 120},
  /tikz/flowchart/flow/.style  = {draw, ->}
}


\begin{document}

\fbox{\begin{tikzpicture}

\matrix [flowchart]
{
  \node [flowchart/cmd] (A1) {Anweisung 1}; \\
  \node [flowchart/cmd] (A2) {Anweisung 2}; \\
                                            \\
  \node [flowchart/cmd] (An) {Anweisung n}; \\
};

\coordinate (B)  at ($(A1) + (0, 0.8)$);
\coordinate (E)  at ($(An) - (0, 0.8)$);

\begin{scope} [flowchart/flow]
  \draw (B)  -- (A1);
  \draw (A1) -- (A2);
  \draw (A2) -- (An) node [midway, fill = white] {$\vdots$};
  \draw (An) -- (E);
\end{scope}

\end{tikzpicture}}

\end{document}
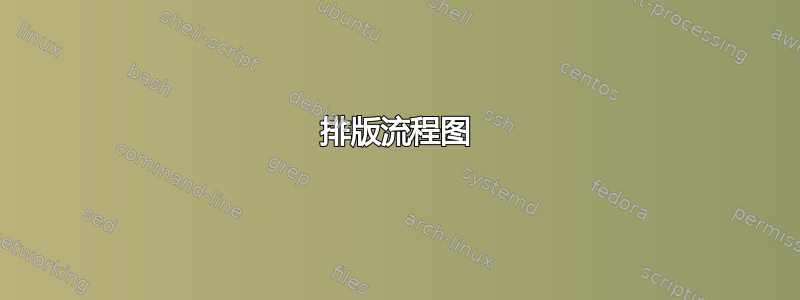
产生以下结果:

以下是我的问题:
- 有没有一种使用 TikZ(无需节点)绘制中断线的简单方法?
- 我怎样才能去除边距以实现紧密的边界框?
- 代码中还有什么可以简化或改进的吗?
答案1
使用库代替tikz包:chainsmatrix
%\documentclass{scrartcl}
\documentclass[border=3mm]{standalone}
\usepackage[T1]{fontenc}

\usepackage{tikz}
\usetikzlibrary{arrows.meta,
                chains,
                positioning}
\tikzset{%
   node distance = 3ex,
     start chain,
     base/.style = {draw, text height = height("A"), text depth = depth("g")},
    begin/.style = {base, rectangle, rounded corners = .5em},
      cmd/.style = {base},
     cond/.style = {base, diamond, aspect = 2.7},
      end/.style = {base, rounded corners = .5em},
       io/.style = {base, trapezium, trapezium stretches body,
                    trapezium left angle = 60,  trapezium right angle = 120},
               > = Stealth,
    flow/.style  = {draw, semithick, ->}
        }

\begin{document}
%\fbox{
    \begin{tikzpicture}
    \begin{scope}[nodes={on chain=going below},
                  every join/.style ={flow}]
\node [cmd,join] (A1) {Anweisung 1};
\node [cmd,join] (A2) {Anweisung 2};
\coordinate (aux1);
\coordinate (aux2);
\node [cmd,join] (An) {Anweisung n};
\coordinate[join] (aux3);
    \end{scope}
\draw[semithick]       (chain-2) -- (aux1);
\draw[semithick, densely dotted] (aux1) -- (aux2);
    \end{tikzpicture}
%     }
\end{document}
以上 MWE 显示了第一个和第三个问题的可能解决方案。遗憾的是,第二个问题我不太清楚。

答案2
一个带有 的命题pstricks,在简单tabular环境中定义相关节点并将它们与节点连接链接起来:
\documentclass[svgnames]{article}
\usepackage{pst-node}%
\newcommand{\chartnode}[2]{\psDefBoxNodes{#1}{\fcolorbox{LightSlateGray}{white}{#2}}}

\begin{document}

{\renewcommand{\arraystretch}{4}
\setlength{\fboxsep}{0pt}
\begin{tabular}{c}
\pnode{u} \\[-3ex]
\chartnode{A1}{Anweisung 1} \\
\chartnode{A2}{Anweisung 2}\\[3ex]
\chartnode{An}{Anweisung n} \\[-5ex]
\pnode{d}
\end{tabular}
\psset{linewidth=1pt, linecolor=LightSlateGray, linejoin=1, arrows=->, arrowinset=0.12}
\pcline(u)(A1:tC)
\pcline(A1:bC)(A2:tC)
\pcline(A2:bC)(An:tC)\ncput*[nrot=:U]{$\color{LightSlateGray}\ldots$}
\pcline(An:bC)(d)
}

\end{document}
