

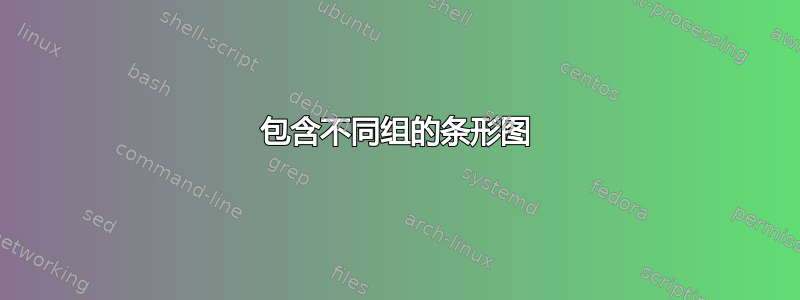
假设您有一个如下所示的分组条形图:

我想要做的是为属于另一个组 A 的新 xtick X0 添加另一个条。
我天真地尝试添加这些数据,结果得到以下结果:

这不是我想要的,因为条形图没有正确居中。可以修复吗?
以下是我用来生成这两个图表的代码:
\documentclass{article}

\usepackage{pgfplots}


\pgfplotsset{compat=1.16}

\pgfplotstableread[row sep=\\,col sep=&]{
    X  & B   & C   & ErrorB & ErrorC \\
    X1 & 0.9 & 0.7 & 0.025  & 0.030 \\
    X2 & 0.8 & 0.6 & 0.010  & 0.010 \\
    X3 & 0.7 & 0.5 & 0.020  & 0.020 \\
}\resultsb


\begin{document}
  \begin{tikzpicture}
    \begin{axis}[
      width=0.9\textwidth,
      bar width=1.5em,
      ybar,
      xtick=data,
      enlarge x limits=0.2,
      symbolic x coords={X0,X1,X2,X3},
      legend entries={B,C},
      ]
      \addplot+[error bars/.cd,y dir=both,y explicit]
        table [x=X,y=B,y error=ErrorB] {\resultsb};
      \addplot+[error bars/.cd,y dir=both,y explicit]
        table [x=X,y=C,y error=ErrorC] {\resultsb};
    \end{axis}
  \end{tikzpicture}
\end{document}
。
\documentclass{article}

\usepackage{pgfplots}


\pgfplotsset{compat=1.16}

\pgfplotstableread[row sep=\\,col sep=&]{
    X  & A   & ErrorA \\
    X0 & 1.0 & 0.015 \\
}\resultsa

\pgfplotstableread[row sep=\\,col sep=&]{
    X  & B   & C   & ErrorB & ErrorC \\
    X1 & 0.9 & 0.7 & 0.025  & 0.030 \\
    X2 & 0.8 & 0.6 & 0.010  & 0.010 \\
    X3 & 0.7 & 0.5 & 0.020  & 0.020 \\
}\resultsb


\begin{document}
  \begin{tikzpicture}
    \begin{axis}[
      width=0.9\textwidth,
      bar width=1.5em,
      ybar,
      xtick={X0,X1,X2,X3},
      enlarge x limits=0.2,
      symbolic x coords={X0,X1,X2,X3},
      legend entries={A,B,C},
      ]
      \addplot+[error bars/.cd,y dir=both,y explicit]
        table [x=X,y=A,y error=ErrorA] {\resultsa};
      \addplot+[error bars/.cd,y dir=both,y explicit]
        table [x=X,y=B,y error=ErrorB] {\resultsb};
      \addplot+[error bars/.cd,y dir=both,y explicit]
        table [x=X,y=C,y error=ErrorC] {\resultsb};
    \end{axis}
  \end{tikzpicture}
\end{document}
答案1
您可以做的一件事是添加一些bar shift键。
\documentclass{article}

\usepackage{pgfplots}


\pgfplotsset{compat=1.16}

\pgfplotstableread[row sep=\\,col sep=&]{
    X  & A   & ErrorA \\
    X0 & 1.0 & 0.015 \\
}\resultsa

\pgfplotstableread[row sep=\\,col sep=&]{
    X  & B   & C   & ErrorB & ErrorC \\
    X1 & 0.9 & 0.7 & 0.025  & 0.030 \\
    X2 & 0.8 & 0.6 & 0.010  & 0.010 \\
    X3 & 0.7 & 0.5 & 0.020  & 0.020 \\
}\resultsb


\begin{document}
  \begin{tikzpicture}
    \begin{axis}[
      width=0.9\textwidth,
      bar width=1.5em,
      ybar,
      xtick={X0,X1,X2,X3},
      enlarge x limits=0.2,
      symbolic x coords={X0,X1,X2,X3},
      legend entries={A,B,C},
      ]
      \addplot+[bar shift=0em,error bars/.cd,y dir=both,y explicit]
        table [x=X,y=A,y error=ErrorA] {\resultsa};
      \addplot+[bar shift=-1em,error bars/.cd,y dir=both,y explicit]
        table [x=X,y=B,y error=ErrorB] {\resultsb};
      \addplot+[bar shift=1em,error bars/.cd,y dir=both,y explicit]
        table [x=X,y=C,y error=ErrorC] {\resultsb};
    \end{axis}
  \end{tikzpicture}
\end{document}
