

\documentclass[12pt]{article}
\usepackage{pgfplots}
\pgfplotsset{compat=1.15}
\usepackage{tikz, tkz-euclide,tikz-3dplot,ifthen}
\usetikzlibrary{arrows,decorations.markings,calc,fadings,decorations.pathreplacing, patterns, decorations.pathmorphing, positioning}
\usepgfplotslibrary{fillbetween}

\begin{document}
\centering
\begin{tikzpicture}
\begin{axis}[
axis lines=middle,
xlabel={$x$},
ylabel={$y$},
zlabel={$z$},
 view={150}{30},
 ticks=none,
  zmin=-5,zmax=5,
  xmin=-3,xmax=3,
  ymin=-3,ymax=3,
]


\addplot3[surf,shader=interp,domain=-2:2,domain y=-2:2,z buffer=sort,opacity=0.5,samples=50]{x^2-y^2};
\addplot3 [ name path = curve1,domain=-0.3:2, y domain = 0:0,  samples=100]
          (x,-2,{x^2-4});
\addplot3 [dashed, name path = curve1,domain=-2:-0.3, y domain = 0:0,  samples=100]
          (x,-2,{x^2-4});
\addplot3 [ name path = curve1,domain=-2:2, y domain = 0:0,  samples=100]
          (x,2,{x^2-4});
\addplot3 [ name path = curve2,domain=-2:2, y domain = 0:0,  samples=100]
          (2,x,{4-x^2});
\addplot3 [ name path = curve2,domain=-2:2, y domain = 0:0,  samples=100]
          (-2,x,{4-x^2});
\addplot3 [ name path = curve2,domain=0.3:1.5, y domain = 0:0,  samples=100]
          (x,0,{x^2});
\addplot3 [ name path = curve2,domain=-2:-0.3, y domain = 0:0,  samples=100]
          (x,-1,{x^2-(1)^2});
\end{axis}
\end{tikzpicture}
\end{document}
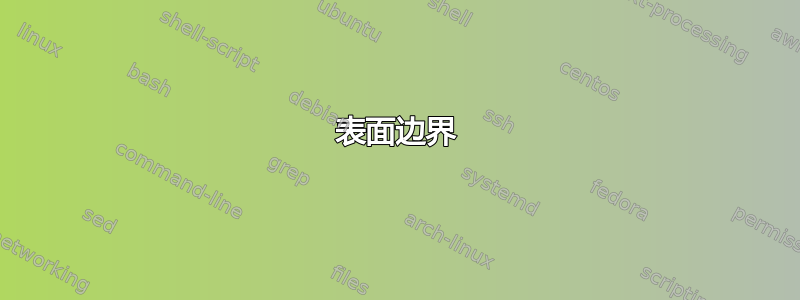
我想绘制下面的表面边界曲线。

我能够画出除顶部边界之外的边界。
利用上述代码,我做了以下操作。

我怎样才能绘制出更好的顶部曲线?
答案1
\documentclass[12pt]{article}


\usepackage{pgfplots}
\pgfplotsset{compat=1.15}
\usepackage{tikz, tkz-euclide,tikz-3dplot,ifthen}
\usetikzlibrary{arrows,decorations.markings,calc,fadings,decorations.pathreplacing, patterns, decorations.pathmorphing, positioning}
\usepgfplotslibrary{fillbetween}

\begin{document}


\centering
\begin{tikzpicture}
\begin{axis}[
axis lines=middle,
xlabel={$x$},
ylabel={$y$},
zlabel={$z$},
 view={150}{30},
 ticks=none,
  zmin=-5,zmax=5,
  xmin=-3,xmax=3,
  ymin=-3,ymax=3,
]


\addplot3[surf,shader=interp,domain=-2:2,domain y=-2:2,z buffer=sort,opacity=0.5,samples=50,
           ]
{x^2-y^2};


\addplot3 [ name path = curve1,domain={2-4/sqrt(3)}:2, y domain = 0:0,  samples=100]
          (x,-2,{x^2-4});
\addplot3 [dotted, thick, name path = curve1,domain=-2:{2-4/sqrt(3)}, y domain = 0:0,  samples=100]
          (x,-2,{x^2-4});
\addplot3 [ name path = curve1,domain=-2:2, y domain = 0:0,  samples=100]
          (x,2,{x^2-4});
\addplot3 [ name path = curve2,domain=-2:2, y domain = 0:0,  samples=100]
          (2,x,{4-x^2});
\addplot3 [ name path = curve2,domain=-2:2, y domain = 0:0,  samples=100]
          (-2,x,{4-x^2});
\addplot3 [ name path = curve2,domain=-2:2, y domain = 0:0,  samples=100]
          (x,{1/2*(x-1)},{x^2-1/4*(x-1)^2});
\addplot3 [ name path = curve2,domain=-2:2, y domain = 0:0,  samples=100]
          ({x},{1/2*(x-1)},{x^2-1/4*(x-1)^2});


\end{axis}
\end{tikzpicture}


\end{document}

我认为我找到了一条曲线,但是当轴旋转时,找到曲线的方程似乎非常困难。