

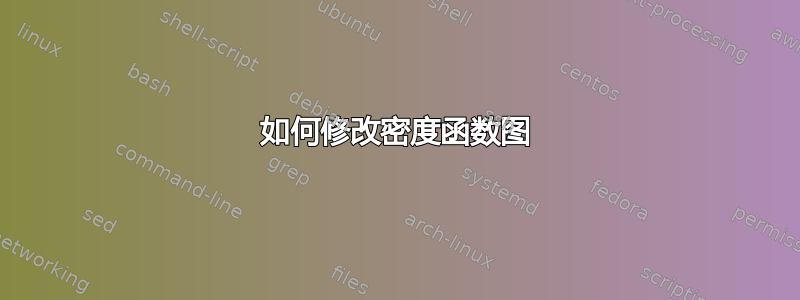
我正在尝试重现这个密度函数图

为了绘制这个图表,我借鉴了这个答案,但有些内容我做了修改。
 \documentclass{article}
    \usepackage{tikz}
    \usetikzlibrary{patterns,intersections}
    \usepackage{pgfplots}
    \begin{document}
    \usepgfplotslibrary{fillbetween}
    \begin{tikzpicture}
    \tikzset{
        hatch distance/.store in=\hatchdistance,
        hatch distance=10pt,
        hatch thickness/.store in=\hatchthickness,
        hatch thickness=2pt
    }

    \makeatletter
    \pgfdeclarepatternformonly[\hatchdistance,\hatchthickness]{flexible hatch}
    {\pgfqpoint{0pt}{0pt}}
    {\pgfqpoint{\hatchdistance}{\hatchdistance}}
    {\pgfpoint{\hatchdistance-1pt}{\hatchdistance-1pt}}%
    {
        \pgfsetcolor{\tikz@pattern@color}
        \pgfsetlinewidth{\hatchthickness}
        \pgfpathmoveto{\pgfqpoint{0pt}{0pt}}
        \pgfpathlineto{\pgfqpoint{\hatchdistance}{\hatchdistance}}
        \pgfusepath{stroke}
    }
    \makeatother

   \begin{axis}[
        xmin=-4,xmax=4,
        xlabel={z},
        ymin=0,ymax=1,
        axis on top,
        legend style={legend cell align=right,legend plot pos=right}]

    \addplot[name path=A,color=red,domain=-4:4,samples=100] {1/sqrt(2*pi)*exp(-x^2/2)};

    \path[name path=B] (axis cs:\pgfkeysvalueof{/pgfplots/xmin},0) -- (axis cs:\pgfkeysvalueof{/pgfplots/xmax},0);

    \addplot[pattern=flexible hatch,pattern color=cyan,draw=blue,hatch distance=5pt, hatch thickness=0.5pt]
    fill between[
        of=A and B,
        soft clip={domain=-1:1},
    ];
    \end{axis}
\end{tikzpicture}
\end{document}
我不知道如何将a、b、$f_X$、添加$p(a \le X \le b)$到轴上。
答案1

xtick可以通过使用 的和xticklabels选项axis设置标签a和坐标和b来实现。也可以使用指定要在 中绘制的图点。x-11(axis cs:x, y)(x, y)tikz
\documentclass{article}
\usepackage{tikz}
\usepackage{pgfplots}
\pgfplotsset{compat=1.17}
\usetikzlibrary{patterns,intersections}
\usepgfplotslibrary{fillbetween}
\begin{document}
    \begin{tikzpicture}
    \tikzset{
        hatch distance/.store in=\hatchdistance,
        hatch distance=10pt,
        hatch thickness/.store in=\hatchthickness,
        hatch thickness=2pt
    }

    \makeatletter
    \pgfdeclarepatternformonly[\hatchdistance,\hatchthickness]{flexible hatch}
    {\pgfqpoint{0pt}{0pt}}
    {\pgfqpoint{\hatchdistance}{\hatchdistance}}
    {\pgfpoint{\hatchdistance-1pt}{\hatchdistance-1pt}}%
    {
        \pgfsetcolor{\tikz@pattern@color}
        \pgfsetlinewidth{\hatchthickness}
        \pgfpathmoveto{\pgfqpoint{0pt}{0pt}}
        \pgfpathlineto{\pgfqpoint{\hatchdistance}{\hatchdistance}}
        \pgfusepath{stroke}
    }
    \makeatother

   \begin{axis}[
            xmin=-4,xmax=4,
            xlabel={\(z\)},
            ymin=0,ymax=1,
            axis on top,
            legend style={legend cell align=right,legend plot pos=right},
            xtick={-1,1},
            xticklabels={\(a\),\(b\)},
        ]

        \addplot[name path=A,color=red,domain=-4:4,samples=100] {1/sqrt(2*pi)*exp(-x^2/2)};

        \path[name path=B] (axis cs:\pgfkeysvalueof{/pgfplots/xmin},0) -- (axis cs:\pgfkeysvalueof{/pgfplots/xmax},0);

        \addplot[pattern=flexible hatch,pattern color=cyan,draw=blue,hatch distance=5pt, hatch thickness=0.5pt]
        fill between[
            of=A and B,
            soft clip={domain=-1:1},
        ];

        % Add labels
        \draw[->] (axis cs:0, 0.2) to[out=60, in=200] (axis cs:1.2, 0.5) node[right] {\(P(a \le X \le b)\)};
        \node at (axis cs:0.2, 0.45) {\(f_x\)};

    \end{axis}
\end{tikzpicture}
\end{document}