

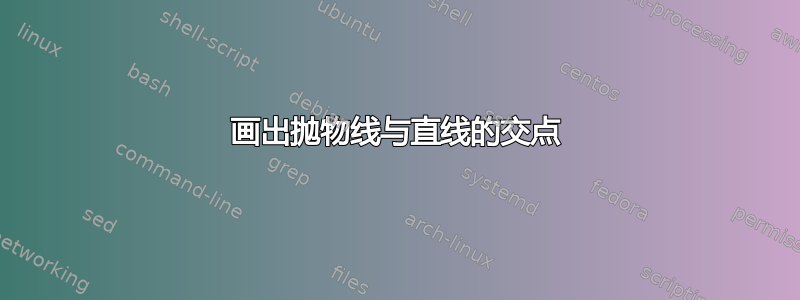
我想绘制抛物线函数和直线的两个图之间的交点
\documentclass[tikz,border=5mm]{standalone}
\usetikzlibrary{intersections}
\begin{tikzpicture}[scale=0.7,>=stealth]
\draw[->](-5,0)--(5,0);
\draw[->](0,-5)--(0,5);
\draw (5,0) node[above]{$x$} (0,5) node[left]{$y$} (0,0) node[below right]{$O$};
\draw[smooth, line width=0.5,color=red] plot[name path=P,domain= -2.1:2.1] (\x,{(\x)^2}) node[right]{$y=x^2$};
\draw[smooth, line width=0.5,color=blue] plot[name path=d,domain= -1.5:2.5] (\x,{(\x)+2}) node[right]{$y=x+2$};
\path[name intersections={of= P and d, by= {A,B}}];
\draw (A) circle (0.04);
\draw (B) circle (0.04);
\end{tikzpicture}
答案1

 \documentclass[12pt,a4paper]{report}
%%%%%%%%%%%%%%%%%%%%%%%%%%%%%%%%%%%%%%%%%%%%%%%

\usepackage{pgfplots,tikz,enumerate,array,fancyhdr,enumitem,fancybox,graphicx,amsfonts,amsmath,amssymb,amsthm,mathrsfs}
\usetikzlibrary{positioning,arrows,shapes,intersections}
\begin{document}

\begin{tikzpicture}[scale=0.7,>=stealth]

\draw[->](-5,0)--(5,0);

\draw[->](0,-5)--(0,5);

\draw (5,0) node[above]{$x$} (0,5) node[left]{$y$} (0,0) node[below right]{$O$};

\draw[smooth, line width=0.5,color=red,name path=P,] plot[domain= -2.1:2.1] (\x,{(\x)^2}) node[yshift=-1cm,right]{$y=x^2$};

\draw[smooth, line width=0.5,color=blue,name path=d,] plot[domain= -1.5:2.5] (\x,{(\x)+2}) node[right]{$y=x+2$};

\path[name intersections={of= P and d, by= {A,B}}];

\draw (A) circle (0.04);

\draw (B) circle (0.04);

\end{tikzpicture}
\end{document}
答案2
您的问题仍然不清楚!以下是我猜测和回答的 ^^[scale]按照您认为合适的方式使用。

\documentclass[tikz,border=5mm]{standalone}
\usetikzlibrary{intersections}
\begin{document}
\begin{tikzpicture}
\draw[->] (-3,0)--(3,0) node[below]{$x$};
\draw[->] (0,-1)--(0,5) node[right]{$y$};
\path (0,0) node[below left]{$O$};
\draw[smooth,red,name path=P] plot[domain= 2.2:-2.2] (\x,{(\x)^2}) node[right]{$y=x^2$};
\draw[smooth,blue,name path=d] plot[domain= 3:-1.5] (\x,{(\x)+2}) node[above left]{$y=x+2$};
\path[name intersections={of= P and d, by= {A,B}}];
\fill[violet]
(A) circle (2pt) (B) circle (2pt);
\end{tikzpicture}
\end{document}
答案3
使用tzplot包裹:

\documentclass[tikz,border=1mm]{standalone}

\usepackage{tzplot}

\begin{document}

\begin{tikzpicture}
\tzaxes(-3,-1)(4,5){$x$}[a]{$y$}[l]
\tzshoworigin{$O$}
\def\Fx{(\x)^2}
\def\Gx{\x+2}
\tzfn[red]\Fx[-2.1:2.1]{$y=x^2$}[al]
\tzfn[blue]\Gx[-1.5:2.5]{$y=x+2$}[r]
\tzXpoint{Fx}{Gx}(A)
\tzdots*(A-1)(A-2);
\end{tikzpicture}

\end{document}