

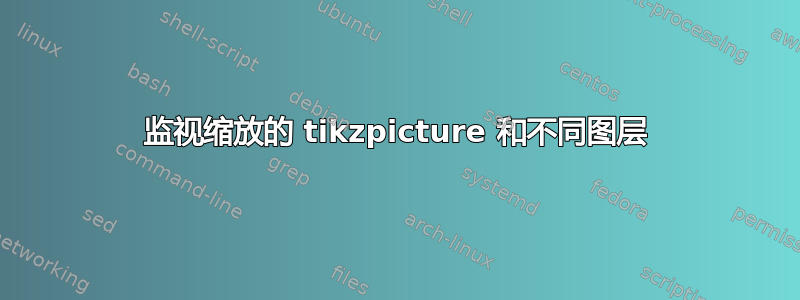
\spy我在缩放的 tikzpicture 上使用时遇到问题。示例代码:
\documentclass[border=0.5mm]{standalone}
\usepackage{tikz}
%\usepackage{tikzscale}
\usepackage{pgfplots}
\pgfplotsset{compat=1.16}
\usetikzlibrary{spy,backgrounds}

\begin{document}
\begin{tikzpicture}[scale=0.75, every node/.style={scale=0.75},
    spy using outlines={circle, magnification=3, connect spies},
    ]
    \begin{axis}
        \addplot+[thick, domain=-10:10, samples=20] {10*x^7};
        \spy[black,size=2cm] on (1.4,2) in node [fill=white] at (4,1.5);
    \end{axis}
\end{tikzpicture}
\end{document}

我想要改变两件事:
被放大的绘图区域和该放大的输出不考虑 tikzpicture 的比例(参见上面的输出)。罪魁祸首似乎是
every node/.style={scale=0.75}。我尝试在整个 tikzpicture 周围使用 \scalebox{0.75}{...},但它似乎没有改变任何东西,将 spy 放在单独的范围内也没有改变任何东西。这尽管该示例中的 tikzpicture 未被缩放,但该帖子似乎具有相关性。如果可能的话,我希望放大的区域显示 10x^7 的曲线无痕迹:
\addplot+[no marks, thick, domain=-10:10, samples=20] {10*x^7};
主面板应显示相同的曲线带有标记:
\addplot+[thick, domain=-10:10, samples=20] {10*x^7};
我尝试过摆弄范围和 pgfonlayer,但似乎无法实现上述效果。无论 \addplot 和 \spy 的顺序如何,间谍区域似乎总是位于顶层。
编辑:我对范围的想法是,我应该能够做类似的事情
\begin{tikzpicture}[scale=0.75, every node/.style={scale=0.75},
    spy using outlines={circle, magnification=3, connect spies},
    ]
    \begin{scope}
    \begin{axis}
        \addplot+[thick, domain=-10:10, samples=20] {10*x^7};
    \end{axis}
    \end{scope}

    \begin{scope}
    \begin{axis}
        \addplot+[no marks, thick, domain=-10:10, samples=20] {10*x^7};
        \spy[black,size=2cm] on (1.4,2) in node [fill=white] at (4,1.5);
    \end{axis}
    \end{scope}
\end{tikzpicture}
应该有两个图形叠加在一起,间谍指向的东西与主面板上显示的不同。但上面的内容显然没有任何作用。
答案1
Spytransform canvas在已定义为 的范围上使用spy scope。间谍节点的创建被推迟到 的末尾spy scope。-所以你不想让tikzpicture整个spy scope。
如果您确实想要缩放图片,您可以使用transform canvas={scale=0.75},但这会产生很多问题。
这里我还创建了两个coordinate使用 PGFPlots 坐标系放置节点:
\documentclass[tikz, border=1cm]{standalone}
\usepackage{pgfplots}
\pgfplotsset{compat=1.18}
\usetikzlibrary{spy}
\begin{document}
\begin{tikzpicture}
\begin{scope}[transform canvas={scale=0.75}]
\begin{axis}
\addplot+[thick, domain=-10:10, samples=20] {10*x^7};
\end{axis}
\begin{scope}[spy using outlines={circle, magnification=3, size=2cm, connect spies}]
\begin{axis}
\addplot+[no marks, thick, domain=-10:10, samples=20] {10*x^7};
\coordinate (spyin) at (-5,0);
\coordinate (spyout) at (3,-0.5e8);
\spy on (spyin) in node[fill=white] at (spyout);
\end{axis}
\end{scope}
\end{scope}
\useasboundingbox (-1,-1) rectangle (6,5);
\end{tikzpicture}
\end{document}
