

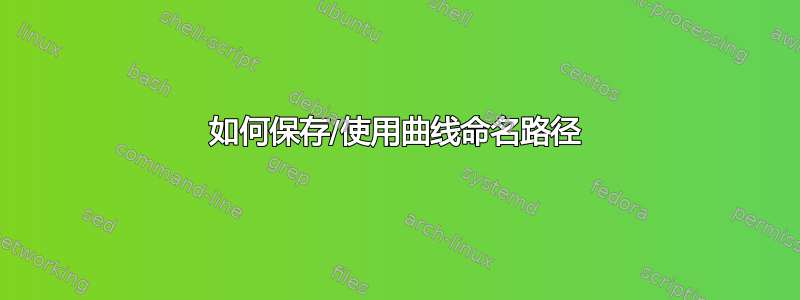
这是一个由 4 条直线和 2 条曲线形成的形状的示例。然后我使用相同的数据为该形状填充颜色。(正确的)结果如下所示:

MWE 代码在这里:
\begin{tikzpicture}
% define and draw the shape
\draw [thin] (0.5,4) -- (1.5,5) -- (2.5,4);
\draw plot[smooth,tension=0.5] coordinates{(2.5,4) (2,3.2) (2.1,2.5) (1.7,1.7) (2,1)};
\draw [thin] (2,1) -- (1,0) -- (0,1);
\draw plot[smooth,tension=0.5] coordinates{(0,1) (0.4,1.7) (0.5,2.5) (0.8,3.2) (0.5,4)};
% fill the shape
\fill [blue,opacity=0.2] (0.5,4) -- (1.5,5) -- (2.5,4)
-- plot[smooth,tension=0.5] coordinates{(2.5,4) (2,3.2) (2.1,2.5) (1.7,1.7) (2,1)}
-- (2,1) -- (1,0) -- (0,1)
-- plot[smooth,tension=0.5] coordinates{(0,1) (0.4,1.7) (0.5,2.5) (0.8,3.2) (0.5,4)};
\end{tikzpicture}
我的问题是我无法保存和重复使用曲线(实际上很长)。例如,这不是工作:
\begin{tikzpicture}
% define and draw the shape
\path[save path=\mypath1] plot[smooth,tension=0.5] coordinates{(2.5,4) (2,3.2) (2.1,2.5) (1.7,1.7) (2,1)};
\draw [thin] (0.5,4) -- (1.5,5) -- (2.5,4);
\draw [use path=\mypath1];
\draw [thin] (2,1) -- (1,0) -- (0,1);
\draw plot[smooth,tension=0.5] coordinates{(0,1) (0.4,1.7) (0.5,2.5) (0.8,3.2) (0.5,4)};
% fill the shape
\fill [blue,opacity=0.2] (0.5,4) -- (1.5,5) -- (2.5,4)
-- plot[smooth,tension=0.5] coordinates{(2.5,4) (2,3.2) (2.1,2.5) (1.7,1.7) (2,1)}
-- (2,1) -- (1,0) -- (0,1)
-- plot[smooth,tension=0.5] coordinates{(0,1) (0.4,1.7) (0.5,2.5) (0.8,3.2) (0.5,4)};
\end{tikzpicture}
此外,我不知道如何在单个\fill命令中包含已保存的路径坐标。有没有简单的解决方案?
实际用例
它有助于通过简要描述我的用例来说明我的需求。我生成了相当数量的 LaTeX 代码 - 目前超过 1000 行,但一行可以包含 13500 字节的坐标数据。PDF 是最终产品。一些图表包含描绘特定区域的线条,这些线条可以为了清晰而着色。由部分边界线(直线)和实际图形线(贝塞尔曲线)组合而成的形状需要着色。
虽然我在 MWE 中输入了相关但具有误导性的数据,但请考虑从右上到左下的中央深蓝色带作为代表性形状。(下图取自 TikZ 诞生之前可能存在的另一个程序。)

请注意,对角线图线也与需要不同颜色的相邻区域接壤。我的目标是节省重复的坐标数据(其中大部分用于描述曲线),以将整体.tex文件大小保持在最低限度,同时节省运行时内存要求,例如在 MiKTeX 中。执行速度不是优先考虑的事项。因此,Jasper Habicht 建议使用宏,这实际上是非常合适的。可以保存和(重新)使用的多个命名路径显然在 TikZ 中不可用(目前 :-)。该spath3库是另一个有趣的选择,需要更陡峭的学习曲线,可能超出了我最初的目标。感谢所有贡献者!
答案1
您始终可以将路径的各个部分存储在宏中,并使用它来将较大的部分粘在一起。例如,这有效:
\documentclass[border=10pt]{standalone}
\usepackage{tikz}

\begin{document}
\begin{tikzpicture}

\newcommand{\mypathA}{
    (1.5,5) -- (2.5,4) -- (2,1) -- (1,0)
}

\fill[blue!20, draw=black]
    (0.5,4) -- \mypathA -- (0,1) -- cycle;

\end{tikzpicture}
\end{document}
但是,如果您想plot在这样的构造中使用该函数,则需要确保事先展开绘制的部分。因此,您可以这样做:
\documentclass[border=10pt]{standalone}
\usepackage{tikz}

\begin{document}
\begin{tikzpicture}

\newcommand{\mypathA}{
    plot[smooth, tension=0.5] coordinates {(2.5,4) (2,3.2) (2.1,2.5) (1.7,1.7) (2,1)}
}
\newcommand{\mypathB}{
    plot[smooth, tension=0.5] coordinates {(0,1) (0.4,1.7) (0.5,2.5) (0.8,3.2) (0.5,4)}
}

\edef\temp{\noexpand\fill[blue!20, draw=black]
    (0.5,4) -- (1.5,5) -- (2.5,4) -- \mypathA --
    (2,1) -- (1,0) -- (0,1) -- \mypathB -- cycle;}\temp

\end{tikzpicture}
\end{document}

但是,如果你的问题是如何在一次移动中填充和绘制一个形状,那么你可以简单地这样做:
\documentclass[border=10pt]{standalone}
\usepackage{tikz}

\begin{document}
\begin{tikzpicture}

\fill[blue!20, draw=black]
    (0.5,4) -- (1.5,5) -- (2.5,4) --
    plot[smooth, tension=0.5] coordinates {(2.5,4) (2,3.2) (2.1,2.5) (1.7,1.7) (2,1)}
    -- (2,1) -- (1,0) -- (0,1) --
    plot[smooth, tension=0.5] coordinates {(0,1) (0.4,1.7) (0.5,2.5) (0.8,3.2) (0.5,4)}
    -- cycle;

\end{tikzpicture}
\end{document}
输出与上面完全一样。