

我正在为正在撰写的文章绘制一些结果,并使用以下代码:
\begin{tikzpicture}
\pgfplotsset{small}
\def\mylistD{50,100, 500, 1000}
\def\mylistR{10, 50}
    \foreach \d [count=\di] in \mylistD {
        \foreach \r [count=\ri] in \mylistR {
            \pgfmathtruncatemacro\myindex{(\di-1)*2+\ri}
            \pgfmathtruncatemacro\currentrow{div(\myindex-1,4)+1}
            \pgfmathtruncatemacro\currentcolumn{mod(\myindex-1,4)+1}
            \pgfmathsetmacro\xposition{4*\currentcolumn-200} % Calculate x position
            \pgfmathsetmacro\yposition{-4*\currentrow} % Calculate y position

            \begin{axis}[
                title style={at={(0.5,0.9)},above,font=\scriptsize},
                title={$m=1000, d=\d, r=\r$},
                ymode=log,
                xlabel={},
                ylabel={},
                ymin=0,
                ytick={0, 10^-1, 10^0, 10^1, 10^2},
                yticklabels={0.1, 1, 10, 100},
                ymax=100,
                xtick={0, 20, 40, 60, 80, 100},
                grid=major,
                width=4.5cm,
                height=4.5cm,
                at={(\xposition cm, \yposition cm)}
            ]
            \addplot[blue, forget plot] table [x=x_tsd, y=y_tsd, col sep=comma] {_fig_example/data_1000_\d_\r.csv};
            \addplot[red, forget plot] table [x=x_rgd, y=y_rgd, col sep=comma] {_fig_example/data_1000_\d_\r.csv};
            \addplot[green, forget plot] table [x=x_tsd_rand, y=y_tsd_rand, col sep=comma] {_fig_example/data_1000_\d_\r.csv};
            \end{axis}
        }

}
% Add common y-label to the tikzpicture environment
\node[rotate=90] at ([xshift=-2mm]current bounding box.west) {\% gap closed}; % You can adjust the shift value as needed
% Add common x-label to the tikzpicture environment
\node at ([yshift=-5mm]current bounding box.south) {\% time elapsed}; % You can adjust the shift value as needed
% Add an explanation below the grid
\node[text width=15cm, align=center, anchor=north] at ([yshift=-5mm]current bounding box.south) {blue=cyclic TSD, green=randomized TSD, red=RGD.};
\end{tikzpicture}
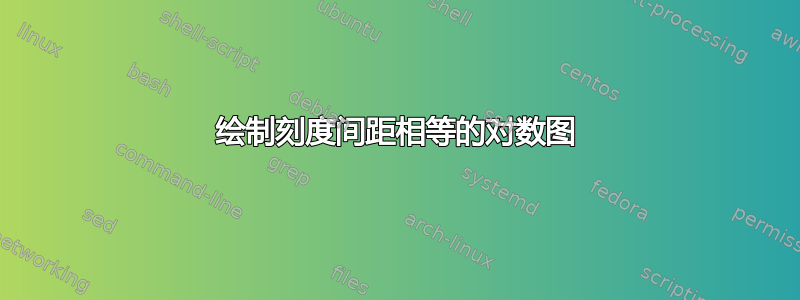
目前看起来是这样的:

我想要做的是让 y 刻度等距分布,并在所有图表上都相同。就像第一个图一样:

我知道在某些图表中红线实际上是水平的并且接近于 0,但这不是问题。可以实现吗?