

如果我从以下 MWE 开始,
\documentclass[tikz]{standalone}
\usetikzlibrary{math}
\begin{document}
\begin{tikzpicture}
\draw [help lines] (0,0) grid (7,7);
\tikzmath{
coordinate \A, \B;
\A =(1,2);
\B =(4,4);
%coordinate \M;
%\M =.5*\A+.5*\B;
}
\draw[fill=black] (\A) circle [radius=1pt] node[above,xshift=-1pt] {$A$};
\draw[fill=black] (\B) circle [radius=1pt] node[above,xshift=-1pt] {$B$};
%\draw[fill=black] (\M) circle [radius=1pt] node[above,xshift=-1pt] {$M$};
\draw (0,4/3)-- (7,6);
\end{tikzpicture}
\end{document}
我明白了

如果我想画出 A、B 点的中点,我可以添加上面注释掉的几行,即,
coordinate \M;
\M =.5*\A+.5*\B;
获取中点的坐标。但是现在我收到以下错误消息:
package tikz Error: cannot parse this coordinate
我该如何纠正这个问题?
答案1
pgfmath我们可以在前三段中找到有关包/库的简短描述
第八部分
数学和面向对象引擎
作者:Mark Wibrow 和 Till Tantau
PGF 带有两个有用的引擎:一个用于数学运算,一个用于面向对象编程。两个引擎都可以独立于主 PGF 使用。
数学引擎的作用是支持使用整数和非整数的加法、减法、乘法和除法等数学运算,以及平方根、正弦、余弦等函数,并生成伪随机数。大多数情况下,您将间接使用 PGF 的数学功能,即当您写入 (5cm*3,6cm/4) 这样的坐标时,但数学引擎也可以独立于 PGF 和 TikZ 使用。
面向对象引擎的作用是支持 TEX 中的简单面向对象编程。它允许定义类(无需继承)、方法、属性和对象。
因此,包作者没有提到它可以直接用于确定坐标。但是,您可以在计算其组件时使用它,例如 x 坐标或 y 坐标的值,但对于坐标计算,您需要使用库启用的不同语法calc。例如,在您的案例中:
\tikzmath{
coordinate \A, \B, \M;
\A = (1,2);
\B = (4,4);
\M = ($(\A)!0.5!(\B)$);   % <--- as defined in the `calc`
}
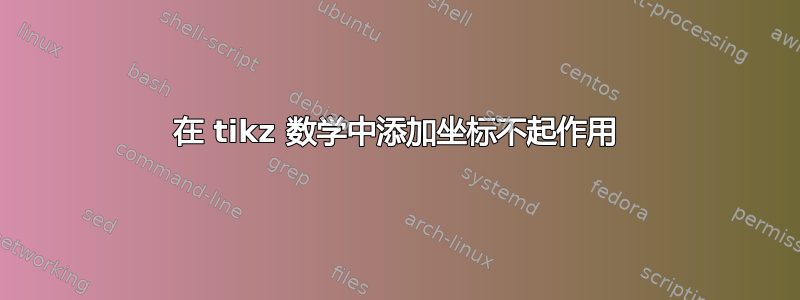
请参阅下面 MWE 中的第一个示例。使用您的方法确定坐标是不寻常的,并且与标准方法相比没有任何优势(如下面的 MWE 中的第二个示例所示):
\documentclass[margin=3mm]{standalone}
\usepackage{tikz}
\usetikzlibrary{math}   % used only in the first example

\begin{document}

\begin{tikzpicture}[
dot/.style = {circle, fill, inner sep=2pt,
              label=#1}
                    ]
\draw [help lines] (0,0) grid (7,7);
\tikzmath{
coordinate \A, \B, \M;
\A = (1,2);
\B = (4,4);
\M = ($(\A)!0.5!(\B)$);
}
\path   (\A) node[dot=$A$] {} -- node (M) [dot=$M$] {} (\B) node[dot=$B$] {};
\draw (0,4/3)-- (7,6);
\node[above right] {with explicit use of the \texttt{tikzmath} library};
\end{tikzpicture}

\qquad or \qquad

\begin{tikzpicture}[
dot/.style = {circle, fill, inner sep=2pt,
              label=#1}
                    ]
\draw [help lines] (0,0) grid (7,7);
\coordinate (A) at (1,2);
\coordinate (B) at (4,4);

\path   (A) node[dot=$A$] {} -- node (M) [dot=$M$] {} (B) node[dot=$B$] {};
\draw (0,4/3)-- (7,6);
\node[above right] {without explicit use of the \texttt{tikzmath} library};
\end{tikzpicture}

\end{document}
