(回复前请阅读:)我会的不是用另一个示例图像替换第二张图片,这篇文章的重点是展示我在尝试使用真实图像时遇到的问题。
我有以下代码,其中的图形被降低以满足我的几何尺寸的顶部边距参数,这解决了我大约一周前提出的问题(即图像超出了边距边框),但我怎样才能使它这样的事情是自动的并且无需指定我希望我的图形降低.02厘米?
% {
\documentclass[letterpaper, 12pt]{article}

\usepackage{graphicx}
\usepackage{newfloat}
\usepackage[showframe, left=1.5cm, right=1.5cm, top=1.5cm, bottom=1.5cm]{geometry}
\usepackage{indentfirst}
\usepackage{fancyhdr}
    \pagestyle{fancy}
    \fancyhf{} % clear all header and footers
    \cfoot{\thepage} % put the page number in the center footer
    \renewcommand{\headrulewidth}{0pt} % remove the header rule
    \addtolength{\footskip}{-.5cm} % shift the footer down which will shift the page number up
\usepackage[backend=biber]{biblatex}
\usepackage{subcaption}
\usepackage{adjustbox}
\usepackage{microtype}
\usepackage{csquotes}
\usepackage{lipsum}
\usepackage{unicode-math}
    \setmainfont{Times New Roman}[Ligatures=TeX]
    \setmathfont{STIX Two Math}
\usepackage[main=english,spanish]{babel}

\makeatletter
\renewcommand{\@maketitle}{%
\newpage
\null
\vspace{-0.125cm} % This corresponds to the top margin set by geometry
\begin{center}
\parskip=0pt
\let\footnote\thanks
{\LARGE \@title \par }%
\vspace{0cm} % Adjust this value to control the space between the title and author
{\large \lineskip .5em%
\begin{tabular}[t]{c}%
\@author
\end{tabular}%
\par }%
\vspace{.25cm} % Adjust this value to control the space between the author and date
{\large \@date }%
\end{center}\par
\vspace{.25cm} % Adjust this value to control the space between the date and content after maketitle
}
\makeatother % ask if you want to change the spacing of the 3 top sections

\renewcommand{\arraystretch}{1.5} % this makes tables look better

\setlength\parindent{.5cm}
% }

\title{Title Random}
\author{David Patterson}
\date{\today}

\begin{document}

\noindent
\begin{minipage}{\textwidth}
\maketitle
\end{minipage}

\begin{center}
\begin{large}
\textsc{\RN{1}. Introduction}
\end{large}
\end{center}

\lipsum[1]

\begin{figure}[htb]
    \centering
    \includegraphics[width=.5\textwidth]{example-image}
    \caption*{Fig. 2: A random image.}
    \label{example}
\end{figure}

\begin{center}
\begin{large}
\textsc{\RN{2}. Second Part}
\end{large}
\end{center}

\lipsum[2]

\newpage

\begin{figure}[htb]
    \centering
        \begin{adjustbox}{margin=.02cm}
            \includegraphics[width=.4\textwidth]{04_figure.jpg}
        \end{adjustbox}
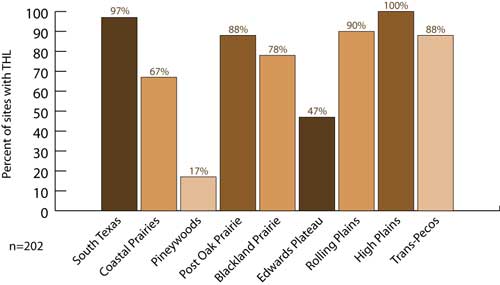
    \caption*{Fig. 2: A statistic showing the population of the Texas Horned Lizard, with it having a low distribution percentage in the Pineywoods area.}
    \label{Texas Horned Lizard}
\end{figure}

\end{document}
与以下相比
% {
\documentclass[letterpaper, 12pt]{article}

\usepackage{graphicx}
\usepackage{newfloat}
\usepackage[showframe, left=1.5cm, right=1.5cm, top=1.5cm, bottom=1.5cm]{geometry}
\usepackage{indentfirst}
\usepackage{fancyhdr}
    \pagestyle{fancy}
    \fancyhf{} % clear all header and footers
    \cfoot{\thepage} % put the page number in the center footer
    \renewcommand{\headrulewidth}{0pt} % remove the header rule
    \addtolength{\footskip}{-.5cm} % shift the footer down which will shift the page number up
\usepackage[backend=biber]{biblatex}
\usepackage{subcaption}
\usepackage{adjustbox}
\usepackage{microtype}
\usepackage{csquotes}
\usepackage{lipsum}
\usepackage{unicode-math}
    \setmainfont{Times New Roman}[Ligatures=TeX]
    \setmathfont{STIX Two Math}
\usepackage[main=english,spanish]{babel}

\makeatletter
\renewcommand{\@maketitle}{%
\newpage
\null
\vspace{-0.125cm} % This corresponds to the top margin set by geometry
\begin{center}
\parskip=0pt
\let\footnote\thanks
{\LARGE \@title \par }%
\vspace{0cm} % Adjust this value to control the space between the title and author
{\large \lineskip .5em%
\begin{tabular}[t]{c}%
\@author
\end{tabular}%
\par }%
\vspace{.25cm} % Adjust this value to control the space between the author and date
{\large \@date }%
\end{center}\par
\vspace{.25cm} % Adjust this value to control the space between the date and content after maketitle
}
\makeatother % ask if you want to change the spacing of the 3 top sections

\renewcommand{\arraystretch}{1.5} % this makes tables look better

\setlength\parindent{.5cm}
% }

\title{Title Random}
\author{David Patterson}
\date{\today}

\begin{document}

\noindent
\begin{minipage}{\textwidth}
\maketitle
\end{minipage}

\begin{center}
\begin{large}
\textsc{\RN{1}. Introduction}
\end{large}
\end{center}

\lipsum[1]

\begin{figure}[htb]
    \centering
    \includegraphics[width=.5\textwidth]{example-image}
    \caption*{Fig. 2: A random image.}
    \label{example}
\end{figure}

\begin{center}
\begin{large}
\textsc{\RN{2}. Second Part}
\end{large}
\end{center}

\lipsum[2]

\newpage

\begin{figure}[htb]
    \centering
    \includegraphics[width=.4\textwidth]{04_figure.jpg}
    \caption*{Fig. 2: A statistic showing the population of the Texas Horned Lizard, with it having a low distribution percentage in the Pineywoods area.}
    \label{Texas Horned Lizard}
\end{figure}


\end{document}
并导致了
adjustbox有没有可以自动执行我需要的操作的设置?我的示例中的图像是这个。
答案1
将您的示例简化为:
\documentclass{article}

\usepackage{graphicx,xcolor}
\usepackage[showframe, left=1.5cm, right=1.5cm, top=1.5cm, bottom=1.5cm]{geometry}

\begin{document}

\begin{figure}[htb]
    \centering
    \includegraphics[page=1,width=.4\textwidth]{example-image-a4-numbered}
    \caption{Test}
\end{figure}

\end{document}
我发现,该geometry选项showframe似乎绘制了文本区域的顶部框架线里面文本区域。您也可以使用以下方法执行此操作:
\documentclass{article}

\usepackage{xcolor}
\usepackage[showframe, left=1.5cm, right=1.5cm, top=1.5cm, bottom=1.5cm]{geometry}

\begin{document}

\noindent{\textcolor{red}{\raisebox{-\dp\strutbox}{\rule{.5\textwidth}{\textheight}}}}

\end{document}
以下是放大 5000% 后左上角的截图:
改用包showframe(并将框架移到背景中):
\documentclass{article}

\usepackage{xcolor}
\usepackage[left=1.5cm, right=1.5cm, top=1.5cm, bottom=1.5cm]{geometry}
\usepackage[noframe]{showframe}
\AddToShipoutPictureBG{\ShowFramePicture}

\begin{document}

\noindent{\textcolor{red}{\raisebox{-\dp\strutbox}{\rule{.5\textwidth}{\textheight}}}}

\end{document}
显示正确的结果:
回到你的问题:通过你的例子,但是用包showframe来可视化区域,我得到:
因此,恕我直言,这并没有什么问题,但德国谚语“Wer viel misst, misst Mist”的意思是:“如果你测量很多,你就会测量垃圾。”)。换句话说,图像被正确地放置在文本区域的顶部,因此它尊重的设置geometry,即使显示的框架geometry表明并非如此。
顺便说一句:你的例子可以简化而不失去任何东西:
\documentclass{article}

\usepackage{graphicx,xcolor}
\usepackage[showframe, left=1.5cm, right=1.5cm, top=1.5cm, bottom=1.5cm]{geometry}

\begin{document}

\begin{figure}[htb]
    \centering
    \includegraphics[width=.4\textwidth]{04_figure.jpg}
    \caption{Test}
\end{figure}
甚至:
\documentclass{article}

\usepackage{graphicx,xcolor}
\usepackage[showframe, left=1.5cm, right=1.5cm, top=1.5cm, bottom=1.5cm]{geometry}

\begin{document}

\begin{figure}[htb]
    \centering
    \includegraphics[page=1,width=.4\textwidth]{example-image-a4-numbered}
    \caption{Test}
\end{figure}

\end{document}


