

我想将下表中具有百分比的数字放置在单元格的中心(水平和垂直):
\documentclass{article}
\usepackage{booktabs}
\usepackage{array}

\begin{document}

\begin{table}[htbp]
\centering
\caption{Table Caption}
\begin{tabular}{@{}p{2.5cm}*{4}{>{\centering\arraybackslash}p{3cm}}@{}}
\toprule
\textbf{Aspect} & \textbf{Wave 4} & \textbf{Wave 5} & \textbf{Wave 6} & \textbf{Wave 7} \\
\midrule
Period & 1980-1990 & 1991-2001 & 2002-2008 & 2009-2020 \\
\hline
Scale (average as \% US GDP) & \multicolumn{1}{>{\centering\arraybackslash}p{3cm}|}{7\%} & \multicolumn{1}{>{\centering\arraybackslash}p{3cm}|}{12\%} & \multicolumn{1}{>{\centering\arraybackslash}p{3cm}|}{10\%} & \multicolumn{1}{>{\centering\arraybackslash}p{3cm}@{}}{10\%} \\
\hline
Geographical Scope & US, UK, Europe & US, UK, Europe, Asia & US, UK, Europe, Asia & US, UK, Europe, Asia \\
\hline
Industries & Manufacturing, Energy, Consumer Products & Manufacturing, Hitech, Media, Consumer Products \& Services & Manufacturing, Hitech, Consumer Products \& Services, Healthcare & Manufacturing, Hitech, Consumer Products \& Services, Healthcare \\
\hline
Industry Relatedness & 60\% & 70\% & 75\% & 75\% \\
\hline
US cross-border activity & 15\% & 25\% & 30\% & 30\% \\
\hline
M\&A outcome & Elimination of inefficiencies & Global Expansion and technology absorption & Monopolization, global expansion and technology absorption & Monopolization, global expansion and technology absorption \\
\hline
Other Events coinciding with beginning and end & Anti-trust policy change, stock market boom and crash & Stock market boom and crash (dot.com bubble) & Economic expansion, stock market boom and crash & QE, stock market boom and crash \\
\bottomrule
\end{tabular}
\end{table}

\end{document}
答案1
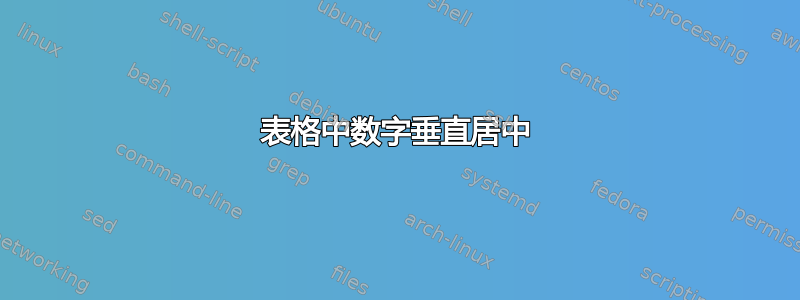
我将提供一个乍看起来似乎违反直觉的建议:与其通过修改某些列属性来满足 OP 的要求,我建议将所有 7 个实例替换为\hline(\addlinespace基本上是垂直空格)。通过删除内部水平线并插入空格,人们也无需摆弄百分比数字的垂直定位。
另外,我建议切换到一个tabularx环境以确保表格适合文本块的宽度。

\documentclass{article}
\usepackage[letterpaper,margin=1in]{geometry} % set page parameters suitably
\usepackage{booktabs}  % for well-spaced horizontal rules
\usepackage{tabularx}  % for 'tabularx' env. and 'X' column type
\usepackage{ragged2e}  % for 'RaggedRight'  and '\Centering' macros
\hyphenation{europe related-ness}   % list of hyphenation exceptions
\begin{document}

\begin{table}[htbp]
\caption{Table Caption}

\smallskip
\begin{tabularx}{\textwidth}{@{} >{\RaggedRight}p{2.5cm} *{4}{>{\Centering}X} @{}}
\toprule
Aspect & Wave 4 & Wave 5 & Wave 6 & Wave 7 \\
\midrule
Period & 1980--1990 & 1991--2001 & 2002--2008 & 2009--2020 \\
\addlinespace
Scale (average as \% US GDP) & 7\% & 12\% & 10\% & 10\% \\
\addlinespace
Geographical scope &
US, UK, Europe &
US, UK, Europe, Asia &
US, UK, Europe, Asia &
US, UK, Europe, Asia \\
\addlinespace
Industries &
Manufacturing, Energy, Consumer Products &
Manufacturing, Hitech, Media, Consumer Products \& Services &
Manufacturing, Hitech, Consumer Products \& Services, Healthcare &
Manufacturing, Hitech, Consumer Products \& Services, Healthcare \\
\addlinespace
Industry relatedness & 60\% & 70\% & 75\% & 75\% \\
\addlinespace
US cross-border activity & 15\% & 25\% & 30\% & 30\% \\
\addlinespace
M\&A outcome &
Elimination of inefficiencies &
Global Expansion and technology absorption &
Monopolization, global expansion and technology absorption &
Monopolization, global expansion and technology absorption \\
\addlinespace
Other events coinciding with beginning and end &
Anti-trust policy change, stock market boom and crash &
Stock market boom and crash (dot.com bubble) &
Economic expansion, stock market boom and crash &
QE, stock market boom and crash \\
\bottomrule
\end{tabularx}
\end{table}

\end{document}