

\documentclass{article}
\usepackage[T1]{fontenc}
\usepackage{tikz}
\usepackage{amsmath, amsfonts}
\usetikzlibrary{arrows.meta}


\tikzset{
    customshape/.style={
        fill=lightgray,
        draw=none,
        insert path={
            (0,0) -- (0,-0.5) -- (0.5,-0.5) -- (0.5,-0.625) -- (0.725,-0.375) -- (0.5,-0.125) -- (0.5,-0.25) -- (0.25,-0.25) -- (0.25,0) -- cycle
        }
    },
    mybox/.style={
        rectangle,
        rounded corners=0.1cm,
        minimum width=1cm,
        minimum height=0.5cm,
        fill=lightgray,
        text=black,
        anchor=west
    }
}

\begin{document}
\begin{tikzpicture}
\draw [customshape]
\end{tikzpicture}
\end{document}
这是我的代码,我无法将自定义形状与我制作的框放在一起

答案1
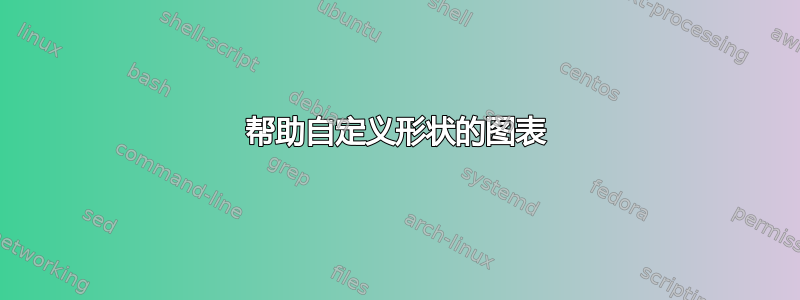
我建议先画出方框,然后用箭头连接它们:
\documentclass{standalone}
\usepackage{tikz}
\usetikzlibrary{arrows.meta,positioning}

\tikzset{
    customshape/.style={
      lightgray!50,
      line width=0.5cm,
      arrows={-Stealth[inset=0pt, angle=90:10pt,width=0.8cm,length=0.8cm]}
    },
    mybox/.style={
      rectangle,
      rounded corners=0.3cm,
      text width=3cm,
      minimum height=2cm,
      fill=lightgray,
      text=white,
      font=\sffamily,
      draw=white,
      line width=2pt,
      align=center
    }
}

\definecolor{cola}{RGB}{127,100,161}
\definecolor{colb}{RGB}{103,94,171}

\begin{document}
\begin{tikzpicture}
\node[mybox,fill=cola] (A){Verification};
\node[mybox,fill=colb,below right=0.2cm and -0.6cm of A] (B) {Detection \& Localisation};

\draw[customshape,cola!20] ([xshift=0.5cm]A.south west) |- (B.west);
\end{tikzpicture}
\end{document}
