

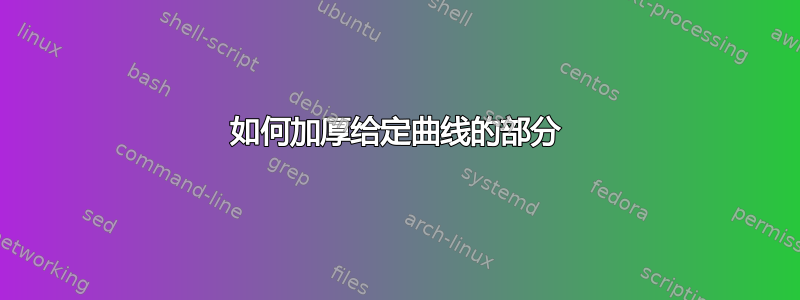
我有以下曲线和与直线的交点。我想加粗线段 $p_1p_2$ 给出的部分以及 $p_1$ 和 $p_2$ 之间的圆弧。
\documentclass[tikz,border=5pt]{standalone}
\usetikzlibrary{decorations.pathreplacing,bending}
\makeatletter
\usepackage{caption}

\usetikzlibrary{intersections,calc}
\tikzset{
    on each segment/.style={
        decorate,
        decoration={
            show path construction,
            moveto code={},
            lineto code={
                \path [#1]
                (\tikzinputsegmentfirst) -- (\tikzinputsegmentlast);
            },
            curveto code={
                \path [#1] (\tikzinputsegmentfirst)
                .. controls
                (\tikzinputsegmentsupporta) and (\tikzinputsegmentsupportb)
                ..
                (\tikzinputsegmentlast);
            },
            closepath code={
                \path [#1]
                (\tikzinputsegmentfirst) -- (\tikzinputsegmentlast);
            },
        },
    },
}
\makeatother
\begin{document}

\clearpage

\begin{tikzpicture}

    \begin{scope}[scale=2]
        \draw[smooth,tension=1,]
        plot coordinates{(0.6,0.9) (1,2.2) (2,-0.5) (1,-1) (1,1) (1,2.3)  (1.3,-0.9)};

            \draw[name path=line,smooth](0.8,-0.5) -- (1.8,1.8)
            node[pos=0.39,circle,fill,inner sep=1pt] {}
            node[pos=0.37, right] {$p_1$}

            node[pos=0.76,circle,fill,inner sep=1pt] {}
            node[pos=0.74, right] {$p_2$};


    \end{scope}


\end{tikzpicture}

\end{document}

答案1
首先,既然您加载了该intersections库,我建议您实际使用它并让 PGF 自动放置节点:
\documentclass[tikz, border=5pt]{standalone}
\usetikzlibrary{intersections}

\begin{document}

\begin{tikzpicture}
    \begin{scope}[scale=2]
        \draw[smooth, tension=1, name path=curve]
            plot coordinates{(0.6,0.9) (1,2.2) (2,-0.5) (1,-1) (1,1) (1,2.3) (1.3,-0.9)};

        \draw[name path=line, smooth] (0.8,-0.5) -- (1.8,1.8);

        \fill[name intersections={of=curve and line}]
            (intersection-3) circle[radius=1pt] node[right] {$p_1$}
            (intersection-1) circle[radius=1pt] node[right] {$p_2$};
    \end{scope}
\end{tikzpicture}

\end{document}

至于特定段的样式,您可以使用fillbetweenPGFPlots 附带的库(并且还会加载该intersections库):
\documentclass[border=5pt]{standalone}
\usepackage{pgfplots}
\pgfplotsset{compat=newest}
\usetikzlibrary{pgfplots.fillbetween}

\begin{document}

\begin{tikzpicture}
    \begin{scope}[scale=2]
        \draw[smooth, tension=1, name path=curve]
            plot coordinates{(0.6,0.9) (1,2.2) (2,-0.5) (1,-1) (1,1) (1,2.3) (1.3,-0.9)};

        \draw[name path=line, smooth] (0.8,-0.5) -- (1.8,1.8);

        \fill[name intersections={of=curve and line}]
            (intersection-3) circle[radius=1pt] node[right] {$p_1$}
            (intersection-1) circle[radius=1pt] node[right] {$p_2$};

        \draw[very thick, intersection segments={of=curve and line, sequence={L2 -- L3 -- R3}}] -- cycle;
    \end{scope}
\end{tikzpicture}

\end{document}
