

下面的代码
\documentclass{article}
\usepackage{tikz}
\usetikzlibrary{intersections,positioning}

\begin{document}

\begin{tikzpicture}[radius=5]
\draw (0,0) rectangle (5,5);
\draw[name path=c1] (0,0) arc[start angle=-90,end angle=0] -- (5,5);
\draw[name path=c2] (5,0) arc[start angle=0,end angle=90] -- (0,5);
\draw[name path=c3] (5,5) arc[start angle=90,end angle=180] -- (0,5);
\draw[name path=c4] (0,5) arc[start angle=180,end angle=270] -- (5,0);
\begin{scope}
\fill [name intersections={of=c1 and c2}]
  (intersection-1) circle (2pt) node[label=right:$A$] {};
\fill [name intersections={of=c2 and c3}]
  (intersection-1) circle (2pt) node[label=above:$B$] {};
\fill [name intersections={of=c3 and c4}]
  (intersection-1) circle (2pt) node[label=left:$C$] {};
\fill [name intersections={of=c4 and c1}]
  (intersection-1) circle (2pt) node[label=below:$D$] {};
\end{scope}
\end{tikzpicture}

\end{document}
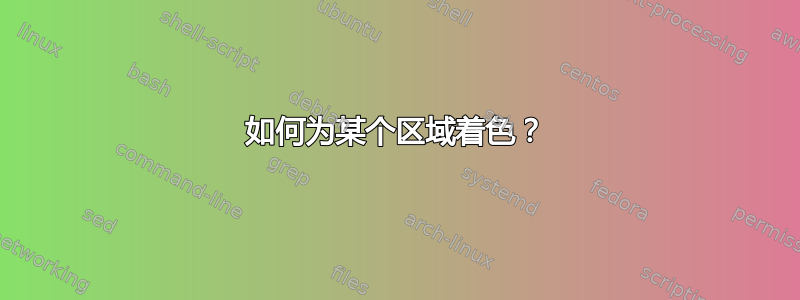
生产

A我怎样才能将颜色仅应用于由、B和C处相交的弧所限制的中心区域D?
答案1
如果您不介意图片中有两次路径,则可以使用裁剪来仅绘制内部区域。裁剪是局部范围的,并且会累积。因此,您可以将图形视为两个重叠的“叶子”,并裁剪到两者,然后填充整个矩形。
\documentclass{article}
\usepackage{tikz}
\usetikzlibrary{intersections,positioning}

\begin{document}

\begin{tikzpicture}[radius=5]
\begin{scope}
\clip (0,0) arc[start angle=-90,end angle=0]   -- (5,5)
            arc[start angle=90,end angle=180]  -- (0,0);
\clip (0,5) arc[start angle=180,end angle=270] -- (5,0)
            arc[start angle=0,end angle=90]    -- (0,5);
\fill [red] (0,0) rectangle (5,5);
\end{scope}
\draw (0,0) rectangle (5,5);
\draw[name path=c1] (0,0) arc[start angle=-90,end angle=0] -- (5,5);
\draw[name path=c2] (5,0) arc[start angle=0,end angle=90] -- (0,5);
\draw[name path=c3] (5,5) arc[start angle=90,end angle=180] -- (0,5);
\draw[name path=c4] (0,5) arc[start angle=180,end angle=270] -- (5,0);
\begin{scope}
\fill [name intersections={of=c1 and c2}]
  (intersection-1) circle (2pt) node[label=right:$A$] {};
\fill [name intersections={of=c2 and c3}]
  (intersection-1) circle (2pt) node[label=above:$B$] {};
\fill [name intersections={of=c3 and c4}]
  (intersection-1) circle (2pt) node[label=left:$C$] {};
\fill [name intersections={of=c4 and c1}]
  (intersection-1) circle (2pt) node[label=below:$D$] {};
\end{scope}
\end{tikzpicture}

\end{document}

答案2
我知道一个解决方案已经被接受了,但这里还有另一个解决方案。这个解决方案使用奇偶规则来填充区域。另一个可用的规则是非零规则。请注意,我必须使用预处理将整个东西涂成蓝色,然后将尖端涂成白色。
\documentclass{article}
\usepackage{tikz}
\usetikzlibrary{intersections,positioning}

\begin{document}

\begin{tikzpicture}

\draw[name path=c1] (0,0) to[out=0,in=-90] (5,5) to [out=180,in=90]  (0,0) ;
\draw[name path=c2] (5,0) to[out=180,in=-90] (0,5) to[out=0,in=90] (5,0);

\fill[even odd rule,white,preaction={fill=blue}]
    (0,0) to[out=0,in=-90] (5,5) to [out=180,in=90]  (0,0)
    (5,0) to[out=90,in=0] (0,5) to[out=-90,in=180] (5,0);

\path[name intersections={of=c1 and c2},fill=red]
    \foreach \i/\name/\pos in {1/$D$/below,2/$A$/right,3/$C$/left,4/$B$/above}{
        (intersection-\i) circle (2pt) node[\pos] {\name}
    };
\end{tikzpicture}
\end{document}
输出为

答案3
使用剪辑。
\documentclass{standalone}
% http://tex.stackexchange.com/q/17300/86
\usepackage{tikz}
\usetikzlibrary{intersections,positioning}

\begin{document}

\begin{tikzpicture}[radius=5]
\draw (0,0) rectangle (5,5);
\begin{scope}
\clip (0,0) arc[start angle=-90,end angle=0] arc[start angle=90,end angle=180];
\clip (5,0) arc[start angle=0,end angle=90] arc[start angle=180,end angle=270];
\fill[green] (0,0) rectangle (5,5);
\end{scope}
\draw[name path=c1] (0,0) arc[start angle=-90,end angle=0];
\draw[name path=c2] (5,0) arc[start angle=0,end angle=90];
\draw[name path=c3] (5,5) arc[start angle=90,end angle=180];
\draw[name path=c4] (0,5) arc[start angle=180,end angle=270];
\begin{scope}
\fill [name intersections={of=c1 and c2}]
  (intersection-1) circle (2pt) node[label=right:$A$] {};
\fill [name intersections={of=c2 and c3}]
  (intersection-1) circle (2pt) node[label=above:$B$] {};
\fill [name intersections={of=c3 and c4}]
  (intersection-1) circle (2pt) node[label=left:$C$] {};
\fill [name intersections={of=c4 and c1}]
  (intersection-1) circle (2pt) node[label=below:$D$] {};
\end{scope}
\end{tikzpicture}

\end{document}
(遗憾的是,在升级我的机器时,我似乎失去了轻松将 pdf 转换为图像的能力,所以你必须等待图片!)
请注意,我填充了该区域前绘制它。否则,填充会超出(一半)线条,看起来不太好看。
(您对弧的语法有点奇怪...您是想在后面加上 s 吗--?我不确定它们为什么在那里。)
答案4
\documentclass{scrartcl}
\usepackage{tkz-euclide}
\usetkzobj{all}
\begin{document}
\begin{tikzpicture}
\tkzDefPoint(0,0){A} \tkzDefPoint(8,0){B}
\tkzDefPoint(8,8){C} \tkzDefPoint(0,8){D}
\tkzDrawPolygon(A,B,C,D)
\begin{scope}
 \tkzClipCircle(B,C) \tkzClipCircle(D,C)
 \tkzClipCircle(A,B) \tkzClipCircle(C,D)
 \tkzDrawPolygon[fill=magenta!40](A,B,C,D)
\end{scope}
\tkzClipPolygon(A,B,C,D)
\tkzDrawCircle(B,C) \tkzDrawCircle(D,C)
\tkzDrawCircle(A,B) \tkzDrawCircle(C,D)
\tkzInterCC(A,B)(B,A) \tkzGetFirstPoint{I}
\tkzInterCC(B,A)(C,B) \tkzGetFirstPoint{J}
\tkzInterCC(C,B)(D,C) \tkzGetFirstPoint{K}
\tkzInterCC(D,C)(A,B) \tkzGetFirstPoint{H}
\tkzDrawPoints(I,J,K,H)
\tkzLabelPoint[above](I){$I$}
\tkzLabelPoint[below](K){$K$}
\tkzLabelPoint[right](H){$H$}
\tkzLabelPoint[left](J){$J$}
\end{tikzpicture}
\end{document}
