

请考虑以下示例:
代码
% pdflatex -shell-escape test.tex

\documentclass{article}

\usepackage{auto-pst-pdf,pst-plot}

\def\seere#1#2#3{%
  \pspolygon[%
    fillstyle=solid,%
    fillcolor=red!45
  ](!2 #1 mul 1 sub \bredde 2 div sub 0)%
   (!2 #1 mul 1 sub \bredde 2 div sub #2)%
   (!2 #1 mul 1 sub \bredde 2 div add #2)%
   (!2 #1 mul 1 sub \bredde 2 div add 0)
  \rput(!2 #1 mul 1 sub #2 5 add){\scriptsize #2\,000}
  \rput{90}(!2 #1 mul 1 sub #2 2 div){\scriptsize #3\,\%}
}

\begin{document}

\def\bredde{0.7 }
\centering
\psset{xunit=0.6cm,yunit=0.042cm}
\begin{pspicture}(21,240)
 \psaxes[
   mathLabel=false,% This removes the math mode on both axes.
   xLabels={%
    ,Nord,%
    ,Midt-Vest,%
    ,{\O}stjylland,%
    ,Syd,%
    ,Fyn,%
    ,{\O}st,%
    ,Bornholm,%
    ,Lorry,%
   },%
   xLabelsRot=90,%
   Dy=2,%
   dy=20,%
   ticks=y,%
   ylabelFactor={\cdot 10^4}%
 ]{->}(0,0)(16,230)[Tv-stationer,0][Seere,90]
 \multido{\i=20+20}{11}{\psline[linestyle=dotted](0,\i)(16,\i)}
 \seere{1}{86}{9.8}
 \seere{2}{87}{9.9}
 \seere{3}{107}{12.2}
 \seere{4}{147}{16.7}
 \seere{5}{102}{11.6}
 \seere{6}{125}{14.2}
 \seere{7}{16}{1.8}
 \seere{8}{210}{23.9}
\end{pspicture}

\end{document}
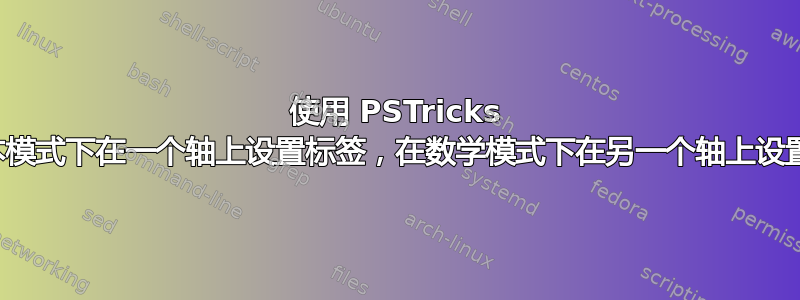
输出

问题
如何在文本模式下获取 x 轴并在数学模式下获取 y 轴?
我看过了pst-plot手动的但我不确定如何重新定义\pshlabel和\psvlabel。
PS:我可能直到明天甚至周一才会再看这个。
答案1
使用
[...]
\begin{pspicture}(21,240)
 \psaxes[
   xAxis=false,%%%%%%%%%
   Dy=2,%
   dy=20,%
   ticks=y,%
   ylabelFactor={\cdot 10^4}]{->}(0,0)(16,230)
 \psaxes[
   mathLabel=false,
   yAxis=false,%%%%%%%%%%%%
   xLabels={%
    ,Nord,%
    ,Midt-Vest,%
    ,{\O}stjylland,%
    ,Syd,%
    ,Fyn,%
    ,{\O}st,%
    ,Bornholm,%
    ,Lorry,%
   },%
  xLabelsRot=90,
 ]{->}(0,0)(16,230)[Tv-stationer,0][Seere,90]
[...]