

我想将高斯曲线放在用 tikz 创建的图表中的特定位置。
我找到了问题TikZ/PGF 中的钟形曲线/高斯函数,我可以用它将高斯曲线添加到我的图表中,但我不知道如何将其放在正确的位置。高斯曲线应该在 tikz 图中以 (0,10) 为中心。这是我目前的代码:
\documentclass[12pt]{article}

\usepackage{tikz}
\usepackage{pgfplots}

\begin{document}
\pagestyle{empty}

\begin{tikzpicture}

\pgfmathdeclarefunction{gauss}{2}{%
  \pgfmathparse{1/(#2*sqrt(2*pi))*exp(-((x-#1)^2)/(2*#2^2))}%
}

\pgfmathsetmacro{\phcy}{3.5}

% draw beam and dimension
\draw[line width=2] (0,\phcy) -- +(-3,10) ;
\draw[line width=2] (0,\phcy) -- +(3,10) ;
\draw[line width=1.5,<->] (0,\phcy) ++(73.6:10) arc (73.6:106.3:10);
\node at (0,\phcy+9.5) {$\Theta_{FWHM}$};

\begin{axis}[style={samples=200,smooth},
    axis lines=none]
\addplot[mark=none] {gauss(0,1)};
\end{axis}

\end{tikzpicture}

\end{document}
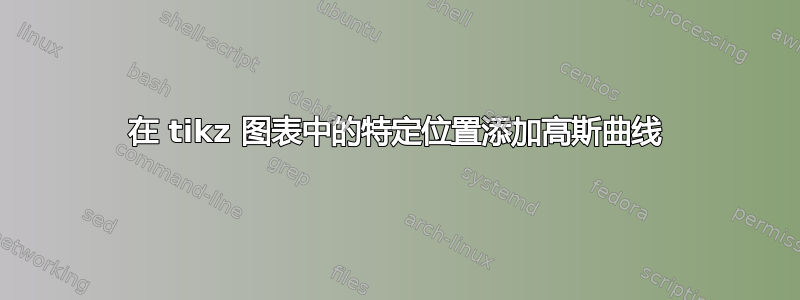
答案1
您可以添加anchor=origin, at={(0,10cm)}选项axis来定位绘图。要使绘图的宽度与绘图的单位相对应,您还可以x=1cm在axis

\documentclass[12pt]{article}

\usepackage{tikz}
\usepackage{pgfplots}

\begin{document}
\pagestyle{empty}

\begin{tikzpicture}

\pgfmathdeclarefunction{gauss}{2}{%
  \pgfmathparse{1/(#2*sqrt(2*pi))*exp(-((x-#1)^2)/(2*#2^2))}%
}

\pgfmathsetmacro{\phcy}{3.5}

% draw beam and dimension
\draw[line width=2] (0,\phcy) -- +(-3,10) ;
\draw[line width=2] (0,\phcy) -- +(3,10) ;
\draw[line width=1.5,<->] (0,\phcy) ++(73.6:10) arc (73.6:106.3:10);
\node at (0,\phcy+9.5) {$\Theta_{FWHM}$};

\begin{axis}[
    anchor=origin,
    x=1cm,
    at={(0,10cm)},
    style={samples=51,smooth},
    hide axis
]
\addplot[mark=none] {gauss(0,1)};
\end{axis}

\end{tikzpicture}

\end{document}