

我想对整数上的两个函数进行良好的可视化。有没有办法写出类似这样的代码:

我想过使用 tikz,但不知道如何使用。
答案1
不需要 TikZ :-)
\documentclass[10pt]{article}
\usepackage{mathtools}
\usepackage{array}
\newcommand\UpArr[1][\sigma]{%
\begin{matrix}
\rlap{\hspace{0.6em}%
\raisebox{-.6\height}{$\mathclap{\downarrow}$}\rule[0.6ex]{3.05em}{0.4pt}\raisebox{-.6\height}{$\mathclap{\downarrow}$}}%
\end{matrix}%
\rlap{\raisebox{1.5ex}{\makebox[4.2em][c]{$#1$}}}%
}
\newcommand\DownArr[1][\tau]{%
\begin{matrix}
\rlap{\hspace{0.6em}%
\raisebox{\depth}{$\mathclap{\uparrow}$}\rule{3.05em}{0.4pt}\raisebox{\depth}{$\mathclap{\uparrow}$}}%
\end{matrix}%
\rlap{\raisebox{-2ex}{\makebox[4.2em][c]{$#1$}}}%
}
\begin{document}
\[
\begin{array}{c*{11}{>{$\hfil}p{2em}<{\hfil$}}c}
& & \UpArr & & \UpArr & & \UpArr & & \UpArr & & \UpArr \\
\cdots & -5 & -4 & -3 & -2 & -1 & \phantom{-}0 & \phantom{-}1 & \phantom{-}2 & \phantom{-}3 & \phantom{-}4 & \phantom{-}5 & \cdots \\
& \DownArr & & \DownArr & & \DownArr & & \DownArr & & \DownArr \\
\end{array}
\]
\end{document}

答案2
另外一个选择
\documentclass[tikz]{standalone}%

\begin{document}
\begin{tikzpicture}
% the loop runs over the to-be-displayed items
%     \x  : Holds the text
%     \xi : Counts the number of spins (starting from 1)
%     \xj : Holds the previous spin number
\foreach \x[count=\xi,evaluate=\x as \xj using {int(\xi-1)}] in {\dots,-5,-4,...,5,\dots}{
% Place a node with the name (n-<spin no>) and with the text in mathmode.
\node (n-\xi) at (0.8*\xi,0) {$\scriptstyle\x$};
% We want to draw backwards so we need to start from -4 which is the third node
% Test if we have passed the initial ... and -5
\ifnum\xi>2\relax   %  Without \relax TeX keeps on parsing numbers
  \ifnum\xi<12\relax%  until it encounters something that doesn't look like a number
                    %  it's not necessary here (\ifnum) is one of those things and a
                    %  comment is too small to explain it :P Please search main site for it
% Now we alternate up and down. This alternating can be smaller, say, only the "above"
% and below text and the coordinate is changed instead of the whole \draw.... Simply
%  we draw from the current \xi'th node to the previous \xj'th one.
    \ifodd\x
    \draw[<->] (n-\xi) |- ++(-0.4,0.4) node[above]{$\sigma$} -| (n-\xj) ;
    \else
    \draw[<->] (n-\xi) |- ++(-0.4,-0.4)  node[below]{$\tau$} -| (n-\xj);
    \fi
  \fi
\fi
% Close all the if cases
}
\end{tikzpicture}
\end{document}

现在我明白了,这应该\ifnum<13是缺点的证据,最好检查列表的最后一个值,而不是对其进行硬编码。
答案3
使用库的更灵活的解决方案chains。我的paths.ortho图书馆可以帮助解决ud和du路径问题。
代码
\documentclass[tikz]{standalone}
\usetikzlibrary{chains}
\makeatletter
\tikzset{
 edge node/.code={\expandafter\def\expandafter\tikz@tonodes\expandafter{\tikz@tonodes#1}},
 empty edge nodes/.code={\let\tikz@tonodes\pgfutil@empty},
 integer function/.code={%
    \tikzset{#1=of \tikzchainprevious}%
    \ifodd\tikzchaincount
      \tikzset{join=by {every odd integer function/.try={#1},
                        integer function \tikzchaincount/.try={#1}}}%
    \else
      \tikzset{join=by {every even integer function/.try={#1},
                        integer function \tikzchaincount/.try={#1}}}%
    \fi}}
\makeatother
\tikzset{
  uddu distance/.initial=.25cm,
  ud/.style={to path={
    -- ([yshift=\pgfkeysvalueof{/tikz/uddu distance}] \tikztostart.north)
    -- ([yshift=\pgfkeysvalueof{/tikz/uddu distance}] \tikztotarget.north) \tikztonodes
    -- (\tikztotarget)}},
  du/.style={to path={
    -- ([yshift=-\pgfkeysvalueof{/tikz/uddu distance}] \tikztostart.south)
    -- ([yshift=-\pgfkeysvalueof{/tikz/uddu distance}] \tikztotarget.south) \tikztonodes
    -- (\tikztotarget)}},
  every odd integer function/.style={ud, edge node={node[every odd node/.try]{$\sigma$}}},
  every even integer function/.style={du, edge node={node[every even node/.try]{$\tau$}}},
  every odd node/.style={midway, above},
  every even node/.style={midway, below}
}
\begin{document}
\begin{tikzpicture}[
  node distance=+.5em,
  text depth=+0pt,
  every join/.append style={<->},
  start chain=ch going {integer function=right},
  integer function 3/.style={bend left=90},
  integer function 5/.style={
    empty edge nodes, edge node={node [above] {$\sigma_5$}}},
  integer function 8/.style={blue},
  ]
\foreach \cnt in {-5, ..., 5}
  \node[on chain=ch, text width=width("$-0$"), align=center] {$\cnt$};

\node[left=of ch-begin] {$\cdots$}; \node[right=of ch-end]  {$\cdots$};
\end{tikzpicture}
\end{document}
输出

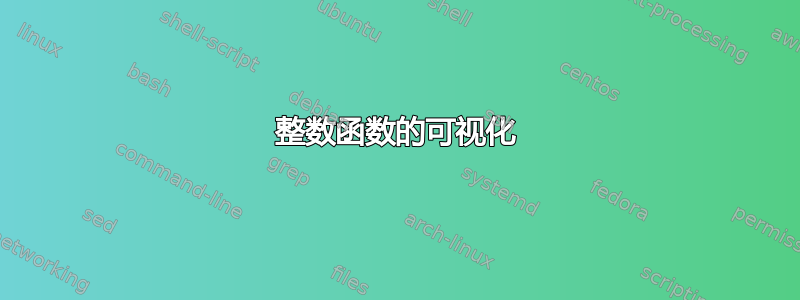
答案4

MWE和Asymptote:
% fint.tex:
\documentclass{article}
\usepackage[inline]{asymptote}
\usepackage{lmodern}
\begin{document}
\begin{asy}
unitsize(20bp);
import roundedpath; defaultpen(fontsize(10pt));
int n=6; real dx=1.2,dy=0.9, hl=0.2, hh=0.8;
guide arsig=roundedpath((dx,dy*hl)--(dx,dy*hh)--(0,dy*hh)--(0,dy*hl),0.2);
guide artau=rotate(180)*arsig;
pen textPen=darkblue, sigPen=blue+0.8bp, tauPen= red+0.8bp;

void draw(int i,guide g,pen p){draw(shift((2i-n+1)*dx,0)*g,p,Arrows(HookHead,size=5,Fill));}

label("\textbf{\dots}",(-(2n-n+1)*dx,0));
for(int i=0;i<n;++i){
  label("$"+string(2i-n)+"$",((2i-n)*dx,0),textPen);
  label("$"+string(2i-n+1)+"$",((2i-n+1)*dx,0),textPen);
  label("$\sigma$",((2i-n+1.5)*dx,dy),sigPen);
  label("$\tau$",((2i-n+0.5)*dx,-dy),tauPen);
  draw(i,arsig,sigPen);
  draw(i,artau,tauPen);
}
label("$"+string(2n-n)+"$",((2n-n)*dx,0));
label("\textbf{\dots}",((2n-n+1)*dx,0));
shipout(bbox(Fill(rgb(1,1,0.5))));
\end{asy}
\end{document}
%
%% Process:
%
% pdflatex fint.tex
% asy -f pdf fint-*.asy
% pdflatex fint.tex