

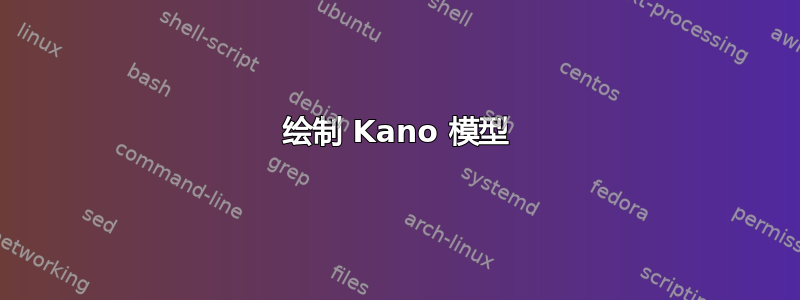
我想知道是否有人可以告诉我绘制下图的最简单方法。我开始使用 pgfplots 包中的 axis 环境,如下面的代码所示,但后来我陷入了困境。
我提前谢谢你!
\documentclass{standalone}
\usepackage{pgfplots}
\begin{document}
\begin{tikzpicture}

\begin{axis}[axis lines=middle,axis equal,grid=both]
    \addplot coordinates{(0,0) (5,5) };
\end{axis}

\end{tikzpicture}
\end{document}

答案1
我认为没有必要使用pgfplots。我认为只需使用 就可以获得想要的效果(并且更容易一些)tikz。
\documentclass[border=5pt]{standalone}
\usepackage{tikz}
\usetikzlibrary{calc}
\usetikzlibrary{arrows.meta}
\begin{document}

\begin{tikzpicture}
  \coordinate (Q) at (0,0);

  %% put this first even though you can use opacity.
  \coordinate (indifferent/nw) at (-0.5in,0.5in);
  \fill[gray,opacity=0.20] (indifferent/nw) rectangle ++ (1in,-1in);
  \path (indifferent/nw) ++ (-0.5cm,0.5cm) node[anchor=south east] (indifferent/label) {indifference};
  \draw (indifferent/nw) -- (indifferent/label.base east);

  \draw[arrows=-Stealth,purple]
       (Q) ++ (-2in,0) node [anchor=east,align=center,text width=0.75in]
                            {Need not~fulfilled}
           --
           ++ (4in,0)  node [anchor=west,align=center,text width=0.75in]
                            {Need well~fulfilled};
  \draw[arrows=-Stealth,purple]
       (Q) ++ (0,-2in) node [anchor=north,align=center,text width=0.75in]
                            {dissatisfied}
           --
           ++ (0,4in)  node [anchor=south,align=center,text width=0.75in]
                            {satisfied};

  \draw[blue,text=blue]
              (Q) ++ (-2in,-2in)
                  --
                  ++ (4in,4in) node[pos=0.75,anchor=north west] {Performance};


  \draw[red,text=red]
             (Q) ++ (-2in,0.25cm) .. controls (-0.5cm,0.25cm) and
                                              ( 0.5cm,1.00cm)
                                  ..
                    (1.25in,2in)
                    node[pos=0.95,anchor=south east] {Excitement};


 \draw[red,text=red]
            (Q) ++ (-1.25in,-2in) .. controls (-0.5cm,-1.00cm) and
                                              ( 0.5cm,-0.45cm)
                                  ..
                   (2in,-0.5cm)
                   node[pos=0.80,anchor=north west] {Basic};


\end{tikzpicture}

\end{document}

这里的基本思想是\draw命令实际上是一种路径,node可以沿着这些路径定义。特别是,我们可以通过使用节点pos=<val>的可选参数来指定节点的位置。锚定有助于将文本放置在我们想要的位置。 text width与的组合align有助于使标签沿x- 轴自动包装和居中(我曾经~让well和fulfilled粘在一起)。最后,文本的颜色也可以使用text=<color>可选参数来指定。最后,我曾经.. controls (<coordinate>) and (<coordinate>) ..构造曲线。现在我意识到我应该尝试让它们沿着表现,但我让你调整一下。
答案2
对于这种半技术性的草图,你可以考虑元帖子作为替代工具。在这里,我遵循我喜欢的顺序,让一切井然有序:定义路径(尽可能相互相对);绘制它们;然后添加标签。

prologues := 3;
outputtemplate := "%j%c.eps";

beginfig(1);
% set a unit scale
u := 1cm;

% define the various paths
path fulfillment, satisfaction, indifference, performance, excitement, basic;
indifference = unitsquare shifted -(1/2,1/2) scaled 2u;
fulfillment  = (left--right) scaled 3u;
satisfaction = fulfillment rotated 90;
performance  = (xpart point 0 of fulfillment, ypart point 0 of satisfaction)
            -- (xpart point 1 of fulfillment, ypart point 1 of satisfaction);

excitement = point 0 of fulfillment shifted (0,1/3u)
             {direction 0 of fulfillment} ..
             {direction 1 of performance}
             point 1 of performance shifted (-1/3u,0);

basic = excitement rotated 180;

% draw the paths
fill      indifference withcolor .9 white;
drawarrow fulfillment  withcolor .5 white;
drawarrow satisfaction withcolor .5 white;
draw      performance  withcolor .67 blue;
draw      excitement   withcolor .67 red;
draw      basic        withcolor .67 green;

% do the labels
verbatimtex
\font\ss=phvr8r\ss
\def\s#1{$\vcenter{\halign{\hfil{##}\hfil\cr#1\crcr}}$}\let\\\cr
etex

label(btex \s{satisfied} etex, point 1 of satisfaction shifted 10 up);
label(btex \s{dissatisfied} etex, point 0 of satisfaction shifted 10 down);

label(btex \s{needs not\\fulfilled}  etex, point 0 of fulfillment shifted 28 left);
label(btex \s{needs well\\fulfilled} etex, point 1 of fulfillment shifted 28 right);

z1 = point 3 of indifference shifted (-u/2,u/2); draw point 3 of indifference -- z1 withcolor .9 white;
label.lft(btex \s{indifference} etex, z1 + 3 up) withcolor .7 white;

label.ulft(btex \s{excitement}  etex, point .9 of excitement)  withcolor .67 red;
label.lrt (btex \s{performance} etex, point .8 of performance) withcolor .67 blue;
label.lrt (btex \s{basic}       etex, point .2 of basic)       withcolor .67 green;

endfig;
end.
笔记
上面的链接向您展示了将 MP 集成到您的工作流程中的各种方法,并包含手册链接。
我为所有路径都使用了相当长的名称,以便您可以更轻松地跟踪所做的操作
u您可以通过调整顶部的值来更改绘图的比例。直线路径只有一段,
point 0起点和point 1终点也是如此。我将其定义为顺时针旋转 90 度
satisfaction的副本,并将其定义为旋转 180 度的副本。这使得图表美观且对称。fulfillmentbasicexcitement我定义了一些非常简单的纯 TeX 命令,让我可以整齐地设置标签。您也可以使用 LaTeX,如手册中所述。确实,使用包
gmp,或者使用luatex,或者context您可以将 MP 代码作为 LaTeX 源文件的一部分包含在内,例如 TikZ。