

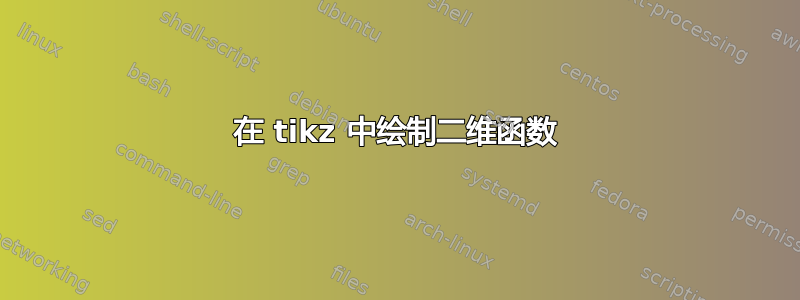
我希望能够在 3D 环境中绘制任何类型的两个变量函数 z = f(x,y),其中 x 和 y 在给定范围内指定。例如,绘制 f(x,y) = x^2 + y^2,其中 x 在 [-2,2] 中,y 在 [-2,2] 中,作为“线框”表面图。我希望此图出现在我绘制的矩形(在同一坐标系中定义)上,没有轴标签。如何做到这一点
\documentclass[border=10pt,varwidth]{standalone}
\usepackage{tikz,tikz-3dplot}
\usepackage{pgfplots}

\pgfplotsset{
    every axis/.append style = {thick},tick style = {thick,black},
    %
    % #1 = x, y, or z
    % #2 = the shift value
    /tikz/normal shift/.code 2 args = {%
        \pgftransformshift{%
            \pgfpointscale{#2}{\pgfplotspointouternormalvectorofticklabelaxis{#1}}%
        }%
    },%
    %
    range3frame/.style = {
        tick align        = outside,
        scaled ticks      = false,
        enlargelimits     = false,
        ticklabel shift   = {10pt},
        axis lines*       = left,
        line cap          = round,
        clip              = false,
        xtick style       = {normal shift={x}{10pt}},
        ytick style       = {normal shift={y}{10pt}},
        ztick style       = {normal shift={z}{10pt}},
        x axis line style = {normal shift={x}{10pt}},
        y axis line style = {normal shift={y}{10pt}},
        z axis line style = {normal shift={z}{10pt}},
    }
}


\begin{document}


% ----- First plot
\tdplotsetmaincoords{70}{155}
\begin{tikzpicture} [scale=3, tdplot_main_coords, axis/.style={->,blue,thick},
vector/.style={-stealth,black,very thick},
vector guide/.style={dotted,black,thick},
]

%standard tikz coordinate definition using x, y, z coords
\coordinate (O) at (0,-0.5,0);

%tikz-3dplot coordinate definition using r, theta, phi coords
\pgfmathsetmacro{\ax}{1}
\pgfmathsetmacro{\ay}{-1}
\pgfmathsetmacro{\az}{0.5}

\coordinate (P) at (\ax,\ay,\az){};

%draw axes
    \draw[axis] (0,-0.5,0) -- (2,-0.5,0) node[anchor=north east]{$y$};   % x-axis becomes y axis
    \draw[axis] (0,-0.5,0) -- (0,-2,0) node[anchor=south]{$x$}; %minius y-axis becomes positive x axis
    \draw[axis] (0,-0.5,0) -- (0,-0.5,2) node[anchor=south]{$z$};


\draw[thick,tdplot_main_coords] (1.5,0.5,0)-- (1.5,-0.5,0) -- (-1.5,-0.5,0)--(-1.5,0.5,0)--cycle;


\begin{axis}[range3frame, view={55}{45}]
    \addplot3[surf, colormap/hot2, samples=41, domain=0:2] {0.1*(x^2+y^2)};
\end{axis}

\end{tikzpicture}

\end{document}
答案1
这个怎么样
\documentclass{article}
\usepackage{pgfplots}
\pgfplotsset{compat=1.12}

\begin{document}

\begin{tikzpicture}
    \begin{axis}[xmin=-2,xmax=2,ymin=-2,ymax=2,axis lines=none]
        \addplot3[mesh] {x^2+y^2};
    \end{axis}
\end{tikzpicture}


\end{document}
它需要一些微调,但它基本上可以起作用。
我稍微修改了一下,添加了axis lines=none隐藏轴线的功能。它仍然有点丑陋,但我不pgfplots经常使用,所以我不太习惯它提供的样式可能性。