

我有以下两个问题:
我想将“基因组位置”标签进一步向下移动
我怎样才能画出我在颜料中添加不当的东西?
这是代码
\centerline{\begin{tikzpicture}[scale=1.5]
% Draw axes
\draw [<->,thick] (0,3) node (yaxis) [above] {}
    |- (5,0) node (xaxis) [below] {};
    \node[below= -10 cm, left= 2 cm] at (xaxis) {genomic position};
\node[rotate=90, above=-2 cm] at (yaxis) {treeheight};
    \draw (0.4,1.5) node[anchor=south] {\textbullet};
        \draw (0.7,1.5) node[anchor=south] {\textbullet};
            \draw (1,1.5) node[anchor=south] {\textbullet};
                \draw (1.3,1.5) node[anchor=south] {\textbullet};
                \draw (1.6,2) node[anchor=south] {\textbullet};
        \draw (1.9,2) node[anchor=south] {\textbullet};
            \draw (2.2,2) node[anchor=south] {\textbullet};
                \draw (2.5,2) node[anchor=south] {\textbullet};
                            \draw (2.8,1.5) node[anchor=south] {\textbullet};
            \draw (3.1,1.5) node[anchor=south] {\textbullet};
                \draw (3.4,1.5) node[anchor=south] {\textbullet};
                \draw (3.7,1.5) node[anchor=south] {\textbullet};
                \draw (4,1.5) node[anchor=south] {\textbullet};\\
                \draw (4.3,1.5) node[anchor=south] {\textbullet};
            \end{tikzpicture}}[![enter image description here][1]][1]

答案1
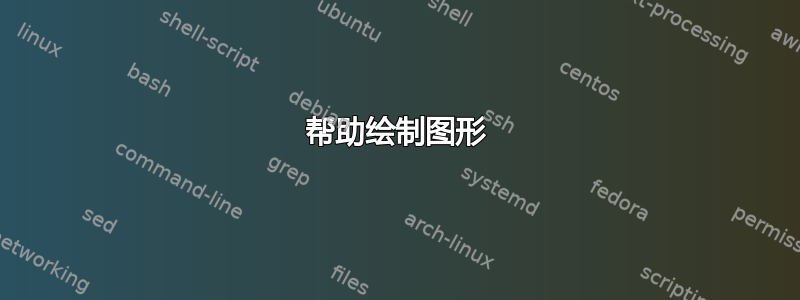
一个建议。我使用两个\foreach循环来绘制点,并在绘制轴线的相同路径中添加轴标签。绘制点的另一种方法是\draw plot coordinates,请参阅注释行。如果您想将轴标签移得离线更远,例如分别对 y 轴和 x 轴使用left=0.5cm和。below=0.5cm
可以使用decorations.pathreplacing库来制作大括号。

\documentclass{article}
\usepackage{tikz}
\usetikzlibrary{decorations.pathreplacing}
\begin{document}

\begin{center}
\begin{tikzpicture}[scale=1.5,decoration={brace}]
% Draw axes
\draw [<->,thick] (0,3) |- (5,0)
    % axis labels. When using (a) |- (b), pos=0.5 is at the corner, so 0.25 is halfway between start and corner and 0.75 is halfway between corner and end
    node [left,anchor=south,rotate=90,pos=0.25] {treeheight}
    node [below,pos=0.75] {genomic position};

% draw the dots
\foreach \x in {0.4,0.7,1,1.3,3.1,3.4,3.7,4,4.3}
  \fill (\x,1.5) circle[radius=1.5pt];
\foreach \x in {1.6,1.9,2.2,2.5,2.8}
  \fill (\x,2) circle[radius=1.5pt];

% The following does the same as the two for loops above
%\draw plot[mark=*,mark size=1.5pt,only marks]
%   coordinates {
%    (0.4,1.5) (0.7,1.5) (1,1.5) (1.3,1.5) (1.6,2) (1.9,2)  (2.2,2)
%    (2.5,2) (2.8,2) (3.1,1.5) (3.4,1.5) (3.7,1.5) (4,1.5) (4.3,1.5)
%    };

% draw the two braces, adding a coordinate a little bit above the center point
\draw [decorate] (1.3,2.4) --coordinate[above=4pt](b1) (1.6,2.4);
\draw [decorate] (2.8,2.4) --coordinate[above=4pt](b2) (3.1,2.4);

% add the recomb node
\node (recomb) at (3.5,3.5) {Recomb events};

% draw lines to the braces
% in=90 means that the end of the line comes in at the angle of 90
% similarly out=240 means that it leaves at an angle of 240 degrees
\draw [-stealth] (recomb) to[in=90,out=240] (b1);
\draw [-stealth] (recomb) to[in=90,out=240] (b2);
\end{tikzpicture}
\end{center}

\end{document}