


我该如何在 Latex 中绘制这个?我对此没有任何经验。
答案1
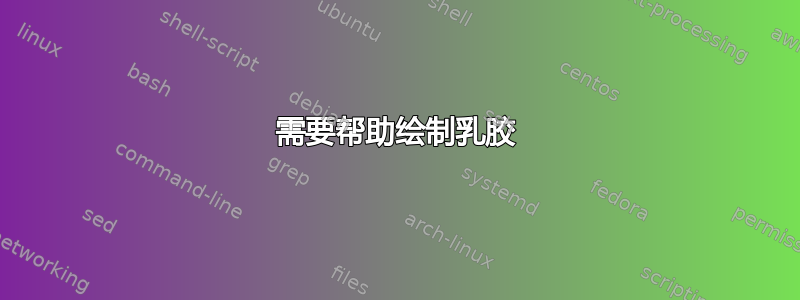
像这样
\documentclass[margin=5mm]{standalone}
 \usepackage{tikz}
 \usetikzlibrary{decorations.pathreplacing}

 \begin{document}
 \begin{tikzpicture}[>=stealth,font=\scriptsize,scale=1.8]

 % draw axis

 \draw[->](0,0)--(4,0)node[below]{1};
 \draw[->](0,0)--(0,4)node[left]{1};;

 % draw ticks

 \foreach \i in {1,2,3}
 {\draw (\i,0.1)--(\i,-0.1)node[below]{$\frac{\i}{4}$};
 \draw (0.1,\i)--(-0.1,\i)node[left]{$\frac{\i}{4}$};
 }

 % draw bullets

 \foreach \i in {0,...,3}
 {\foreach \j in {0,...,3}
 \node[fill=black,circle,inner sep=1pt] (\i-\j) at (\i,\j) {};
 }

 % label for bullets x and y

 \node[below right] at (3-3){$y$};
 \node[below] at (1-2){$x$};
 \draw(1-2)--(3,2);
 \draw[decorate,decoration={brace,raise=3pt}](1-2)--(3-2)node[midway,above=4pt] {$|x-y|_\infty$};

 % dashed arrows

 \draw[dashed,<->](0.2,0)--(0.2,1);
 \draw[dashed,<->](0,0.2)--(1,0.2)node[midway,above,font=\tiny]{$2^{-n}=\frac{1}{2}$};

\end{tikzpicture}
 \end{document}
输出

答案2
如果您只想绘制数学图形,请使用 tkz-euclide(基于 Tikz)。
\documentclass[a4paper]{article}
\usepackage{tkz-euclide}
\usetkzobj{all}

\begin{document}
    \begin{tikzpicture}[scale=2]
    \tkzInit[xmax=1,ymax=1,xstep=0.25,ystep=0.25]
    \tkzDrawX \tkzDrawY
    \tkzLabelX[frac=4,label options={below= 10 pt}]
    \tkzLabelY[frac=4]
    \foreach \i in {0,...,3}
       {\foreach \j in {0,...,3} {\tkzDrawPoint[size=12](\i,\j)}}
    \tkzDefPoints{0.25/0.5/a,0.75/0.5/b}
    \tkzDrawSegment[decorate,
                    decoration={brace,amplitude=12pt},
                    color=black](a,b)
    \tkzDrawSegment(a,b)
    \tkzLabelSegment[above=12pt](a,b){$|x-y|_\infty$}
    \end{tikzpicture}
\end{document}
可以循环定义所有点,但是我发现了一个错误
\foreach \i in {0,...,3}
   {\foreach \j in {0,...,3} {
       \tkzDrawPoint[size=12](\i,\j)
       \tkzDefPoint(0.25*\i,0.25*\j){P\i\j} % bug in tkz-euclide
       % it's anormal to multiply by 0.25 xstep
         }
    }
\tkzDrawSegment[decorate,
                decoration={brace,amplitude=12pt},
                color=black](P12,P32)
\tkzDrawSegment(P11,P31)
\tkzLabelSegment[above=12pt](P12,P32){$|x-y|_\infty$}

答案3
一个pstricks办法:
\documentclass[a4paper,11pt,x11names]{article}
\usepackage[utf8]{inputenc}
\usepackage{fourier}
\usepackage{nicefrac}
\usepackage{pstricks-add}
\usepackage{auto-pst-pdf}

\begin{document}%

\psset{unit=8, arrowinset=0.15}
\begin{pspicture}[](-0.5, -0.5)(1.05,1.05)
    \psset{ticks=all, ticksize=-2.5pt 2.5pt,, dx =0.25, dy =0.25,, labels=none, arrows =->}%, labelsep = 0pt
    \psaxes(0,0)(1.05,1.05)
    \uput[d](0.25,0){\nicefrac14} \uput[d](0.5,0){\nicefrac12} \uput[d](0.75,0){\nicefrac34} \uput[d](1,0){1}
    \uput[l](0, 0.25){\nicefrac14} \uput[l](0,0.5){\nicefrac12} \uput[l](0,0.75){\nicefrac34} \uput[l](0,1){1}
    \multido{\ix=0+1,\nx = 0+0.25}{4}{\multido{\iy=0+1,\ny =0+0.25}{4}{\dotnode(\nx, \ny){A\ix\iy}}}
%%%
    \uput[d](A10){\nicefrac14} \uput[d](A20){\nicefrac12} \uput[d](A30){\nicefrac34} \uput[d](1,0){1}
    \uput[l](A01){\nicefrac14} \uput[l](A02){\nicefrac12} \uput[l](A03){\nicefrac34} \uput[l](0,1){1}
    \uput[dr](A33){$ y $}\uput[d](A12){$x$}
    \psbrace[braceWidthInner=5pt,braceWidthOuter=3pt, braceWidth =0.8pt, rot=-90](A32)(A12){\makebox[0pt]{ $\lvert x-y\rvert_{\infty}$}}
    \psset{linestyle=dashed, linewidth=0.4pt, nodesep=-2pt, offset=1.3ex}
    \ncline[]{A01}{A00}
    \ncline[arrows =<->]{A00}{A10}\naput{$ 2^{-n}=\smash{\frac12}$}
\end{pspicture}

\end{document}
