

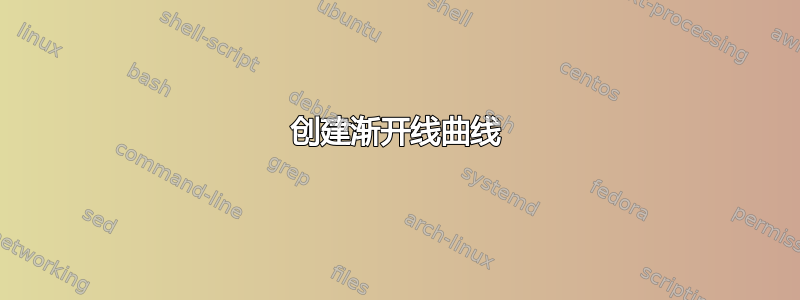
我需要帮助在 Geogebra 或 Tikz 中绘制此图。这是我的论文“通过有限元方法对渐开线直齿轮进行建模”。
答案1
与您的有些不同,但概念是一样的。切线和下弧计算正确,但上弧只是装饰性的。由于各种切线的长度不同,因此很难在那里构建弧。
也许其他人可以在这个部门提供帮助。
输出

代码
\documentclass[margin=10pt]{standalone}
\usepackage{tikz}
\usetikzlibrary{calc, intersections}

\tikzset{
    dot/.style 2 args={fill, circle, inner sep=1pt, label={#1:#2}}
}

\newcommand\Radius{6}

\begin{document}
\begin{tikzpicture}

\begin{scope}[rotate=90,yscale=-1,xscale=1]
\draw[name path=quartarc, thick] (\Radius,0) arc (0:90:\Radius) coordinate[pos=0] (C0);

\foreach \angle [
        count=\n,
        evaluate=\n as \xn using int(5-\n)
    ] in
    {20,45,60,80,90}{%
    \path[name path={tan\n}] (0,0) -- (\angle:{\Radius+1});
    \path[name intersections={of={tan\n} and quartarc,by={P\n}}];
    \pgfmathsetmacro\pointA{cos(\angle)*\Radius}
    \pgfmathsetmacro\pointB{sin(\angle)*\Radius}
    \pgfmathsetmacro\ArcLen{(2*pi*\Radius/360)*\angle}
    \pgfmathsetmacro\pointX{\pointA+sin(\angle)*\ArcLen}
    \pgfmathsetmacro\pointY{\pointB-cos(\angle)*\ArcLen}
    \coordinate (C\n) at (\pointX,\pointY);
}
\end{scope}

\foreach \j [remember=\j as \lastj (initially 0)] in {0,...,5}{
    \draw[thick] (C\lastj) edge[bend left=7.5] (C\j);
}
%
\node[dot={below}{$N_0$}] at (C0) {};
\foreach \x in {1,...,5}{
    \draw[thick] (P\x) -- (C\x) coordinate[pos=0,dot={}{}] coordinate[pos=1,dot={}{}] (a\x);
    \ifnum\x<4\relax
    \node[dot={180-(15*\x)}{$M_\x$}] at (C\x) {};
    \node[dot={255-(15*\x)}{$N_\x$}] at (P\x) {};
    \fi
}

\draw (40:\Radius) --++ (225:3cm) node[fill=white] {$E$};
\draw ($(a3)!.5!(a4)+(110:1mm)$) --++ (110:2cm) node[fill=white] {$I$};

\end{tikzpicture}
\end{document}
答案2
这是一个解决方案

\documentclass[border=5mm,tikz]{article}
\usepackage{mwe}
\usepackage{tikz}
\usetikzlibrary{positioning,calc}

\begin{document}


 \def\Rb{3}
 \def\AngleT{1}

\def\xxt{\Rb*(cos(\t r)+\t*sin(\t r))}
\def\yyt{\Rb*(sin(\t r) - \t*cos(\t r))}

\begin{tikzpicture}

\draw (0,0) circle (\Rb);
\draw[domain=-0:\AngleT,smooth,variable=\t,thick,red,thick]
plot ({atan2(\xxt,\yyt)}:{\Rb*sqrt(1+\t^2)}  )coordinate(ff);
\draw (0,0) -- ({90-\AngleT*180/3.14159} :\Rb)--(ff);
\end{tikzpicture}

\end{document}