

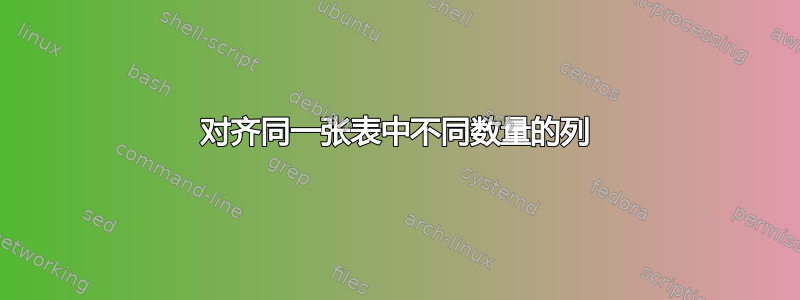
我有一张表格,其中不同面板的列数不同。我想将每个面板的列对齐成等距。例如,在给出的示例中,我无法正确对齐面板 A 的列。我不确定如何做到这一点。任何帮助都将不胜感激。谢谢。
\documentclass[11pt]{article}
\usepackage{setspace}                                   %double spacing and spacing in tables
\usepackage{amsmath}                                    %equations etc. in latex
\usepackage[capposition=top]{floatrow}                  %so that the caption for figures appear at the top
\usepackage[tablename=TABLE,figurename = FIGURE,labelsep=newline,aboveskip=0pt,font=bf,justification=centering]{caption}   %so that caption looks cool
\usepackage{booktabs}                                   %midrule etc. which adds space around lines. Make tables look good.
\usepackage{tabularx}                                   %use tabularx environment for creating one page tables
\usepackage[margin=1in]{geometry}                       %defining the margin for the page
\usepackage[autostyle]{csquotes}                        %for quotes. alternative would be " and "
\usepackage[table]{xcolor}                              %rowcolor, cellcolor, color for references
\usepackage{pdflscape}                                  %landscape and keep the pages straight
\usepackage{everypage}                                  %For AddEveryHookPage
\usepackage{hanging}                                    %For references
\usepackage{longtable}                                  %For multiple pages
\usepackage{multirow}                                   %Valuable package as can be seen from table 5,8, and 10
\usepackage{graphicx}                                   %created line using this package
\usepackage{bm}                                         %bold and italics in the math enviornment at the same time

\makeatletter
\setlength{\@fptop}{0pt}                                %to make tables and figures start at the top of the page
\makeatother

\newcommand{\Lpagenumber}{\ifdim\textwidth=\linewidth\else\bgroup       %to correct the page numbering for landscape pages
    \dimendef\margin=0
    \ifodd\value{page}\margin=\oddsidemargin
    \else\margin=\evensidemargin
    \fi
    \raisebox{\dimexpr -\topmargin-\headheight-\headsep-0.5\linewidth}[0pt][0pt]{%
        \rlap{\hspace{\dimexpr \margin+\textheight+\footskip}%
            \llap{\rotatebox{90}{\thepage}}}}%
    \egroup\fi}
\AddEverypageHook{\Lpagenumber}%                        %to correct the page numbering for landscape pages


\newcolumntype{Y}{>{\centering\arraybackslash}X}        %to center the columns for tabularx environment
\newcolumntype{Z}{>{\centering\arraybackslash}p{0.75in}}    %to center the columns for tabularx environment
\newcolumntype{K}{>{\centering\arraybackslash}p{0.3in}} %to center the columns for tabularx environment
\newcommand{\gmc}[3]{\multicolumn{#1}{@{}#2@{}}{#3}}    %short form for multicolumn
\doublespacing                                          %make lines double spaced


%\author{
%   Sumit Gupta \\ University of California at Berkeley \\ Haas School of Business \\ Berkeley, CA 94720 \\\\ Panos Patatoukas \\ University of California at Berkeley \\ Haas School of Business \\ Berkeley, CA 94720 \\\\ Richard Sloan \thanks{Address: U.C. Berkeley, Haas School of Business, 545 Student Services Building, Berkeley, CA 94720. Phone: (510) 643-1409. Web: https://sites.google.com/site/ykonchit. Email: [email protected].}\\
%   University of California at Berkeley\\ Haas School of Business \\
%   Berkeley, CA 94720 \\
%   }

\title{
        Customer Concentration and Internal Control Weaknesses \thanks{
        We gratefully acknowledge comments from
        }
}

\begin{document}
    \setcounter{page}{-1} %start numbering at page 3 (2 - n where n = -1)
    \maketitle
    \thispagestyle{empty} %suppress page number


        \newpage
%       \section{Introduction}

%Comments: I found that there might be industry specific news, and hence industry-adjusted returns might be the right thing to take care of. Also, how do we tease out the effect of other effects from opening bell ceremonies. If we are interested in establishing the causality effect, then we must remove those data points for which we had a firm-specific news on the same day as well.

    %\newpage
    %\begingroup % keep any font size changes local to group
    %\captionof{table}{Sample Selection and Descriptive Statistics}
    %\singlespacing
    %\small
    %\setlength\tabcolsep{6pt} %default
    %\renewcommand{\arraystretch}{1}

    %\begin{tabularx}{\linewidth}{@{}XKZZ*2{Y}KK*2{Y}@{}}
    %\toprule
    %Event & Anniversary & Celebration & Corporate Rebranding & IPO &  M\&A & NASDAQ Listing & NASDAQ Visit & Spinoff & Total %\\\midrule
    %Closing & 44 & 48 & 4 & 46 & 0 & 10 & 337 & 0 & 489 \\\\
    %Opening & 59 & 71 & 2 & 131 & 3 & 13 & 364 & 5 & 646 \\\\\midrule
    %Total & 103 & 119 & 6 & 177 & 3 & 23 & 701 & 5 & 1,135 \\
    %\end{tabularx}

    %\footnotesize \hrule\medskip
    %\textit{Notes:} This table reports summary data for all Opening and Closing Bell NASDAQ Stock Exchange events held from January 1, 2011 through September 30, 2015, for which there is data available in CRSP and Compustat databases. Bell ceremony events are categorized into 8 event types. IPO is when a firm is celebrating a recent initial public offering. Anniversary is when a firm is celebrating an anniversary of a special event. M\&A is when a firm is celebrating a recent merger or acquisition event. Corporate Rebranding is when a firm is celebrating a recent corporate rebranding. Spinoff is when a firm is celebrating a recent spinoff. NASDAQ Listing is when a firm is celebrating listing its' stock on NASDAQ. Celebration is when a firm is celebrating an event that is not an Anniversary, IPO, M\&A, Corporate Rebranding or a Spinoff. NASDAQ Visit is when a firm cannot be categorized into the other categories and the reason for firm participation in bell ceremony event is not known.  \medskip\hrule
    %\endgroup


    %   \newpage
    %   \begingroup % keep any font size changes local to group
    %   \captionof{table}{NASDAQ Bell Ceremony Events}
    %   \singlespacing
    %   \small
    %   \setlength\tabcolsep{6pt} %default
    %   \renewcommand{\arraystretch}{1}
    %
    %   \begin{tabularx}{\linewidth}{@{}XKZZ*2{Y}KK*2{Y}@{}}
    %       \toprule
    %       Event & Anniversary & Celebration & Corporate Rebranding & IPO &  M\&A & NASDAQ Listing & NASDAQ Visit & Spinoff & Total \\\midrule
    %       Closing & 44 & 48 & 4 & 46 & 0 & 10 & 337 & 0 & 489 \\\\
    %       Opening & 59 & 71 & 2 & 131 & 3 & 13 & 364 & 5 & 646 \\\\\midrule
    %       Total & 103 & 119 & 6 & 177 & 3 & 23 & 701 & 5 & 1,135 \\
    %   \end{tabularx}

    %   \footnotesize \hrule\medskip
    %   \textit{Notes:} This table reports summary data for all Opening and Closing Bell NASDAQ Stock Exchange events held from January 1, 2011 through September 30, 2015, for which there is data available in CRSP and Compustat databases. Bell ceremony events are categorized into 8 event types. IPO is when a firm is celebrating a recent initial public offering. Anniversary is when a firm is celebrating an anniversary of a special event. M\&A is when a firm is celebrating a recent merger or acquisition event. Corporate Rebranding is when a firm is celebrating a recent corporate rebranding. Spinoff is when a firm is celebrating a recent spinoff. NASDAQ Listing is when a firm is celebrating listing its' stock on NASDAQ. Celebration is when a firm is celebrating an event that is not an Anniversary, IPO, M\&A, Corporate Rebranding or a Spinoff. NASDAQ Visit is when a firm cannot be categorized into the other categories and the reason for firm participation in bell ceremony event is not known.  \medskip\hrule
    %   \endgroup

        \newpage
        \begingroup % keep any font size changes local to group
        \captionof{table}{Sample Selection}
        \singlespacing
        \small
        \setlength\tabcolsep{6pt} %default
        \renewcommand{\arraystretch}{1.25}

        \begin{tabularx}{\linewidth}{@{}p{13.5cm}Y@{}}
            \toprule
            \textbf{Sample Selection} & \textbf{Observations}\\\midrule
            \textbf{Panel A: Unique Supplier-Customer Linkages} \\\midrule
            Observations for major customers reported between 1976-2016 in Compustat Customer Segment File & 483,815\\
            \hspace{0.2in} Remove customers with a missing or non-identifiable identity & (295,383) \\\midrule

            Number of supplier-customer linkages used for calculating customer concentration & 188,432 \\\midrule\\\midrule

            \textbf{Panel B: Unique Firm-Year Observations} \\\midrule
            Firm-Year obervations obtained from supplier-customer linkage data in manufacturing industry & 41,122 \\
            \hspace{0.2in} Remove observations with missing values for customer concentration & (6,460) \\
            \hspace{0.2in} Remove non-positive total assets and revenue & (10) \\
            \hspace{0.2in} Remove observations with missing compustat variables  & (7,430) \\
            \hspace{0.2in} Remove observations with missing business segment data & (635) \\
            \hspace{0.2in} Trim continuous variables (except customer concentration) at 1\% and 99\% level & (3,619) \\\midrule
            Final Sample Size & 22,968
        \end{tabularx}

        \footnotesize \hrule
        \endgroup


\newpage
\begingroup % keep any font size changes local to group
%\setlength\tabcolsep{2pt} % default value: 6pt
\singlespacing
\footnotesize
\setlength\tabcolsep{3pt} %default
\renewcommand{\arraystretch}{0.99}

\begin{longtable}{@{\extracolsep{\fill}}l*{13}{K}@{\extracolsep{\fill}}}

    \caption{\textbf{Descriptive Statistics}}\\\\
    \endfirsthead
    \caption{\textbf{Descriptive Statistics}}\\\\
    \endhead
    \bottomrule\gmc{10}{r}{\small\textit{(Continued)}}\endfoot
    \endlastfoot
    \toprule\toprule
    \gmc{14}{l}{\textbf{Panel A: Empirical Distributions}}  \\\midrule
    \gmc{2}{l}{\textbf{Variables}} & \gmc{2}{c}{\textbf{N}} & \gmc{2}{c}{\textbf{Mean}} & \gmc{2}{c}{\textbf{SD}} & \textbf{P1} & \textbf{P25} & \textbf{P50} & \textbf{P75} & \gmc{2}{c}{\textbf{P99}} \\\midrule
        \gmc{2}{l}{CC} &    \gmc{2}{c}{22,968} &         \gmc{2}{c}{0.12} &       \gmc{2}{c}{0.23} &       0.00 &        0.02 &        0.05 &        0.13 &        \gmc{2}{c}{0.94} \\
        \gmc{2}{l}{MV} &    \gmc{2}{c}{22,968} &      \gmc{2}{c}{1015.04} &    \gmc{2}{c}{4323.21} &       1.09 &       20.29 &       82.83 &      393.92 &    \gmc{2}{c}{19628.09} \\
        \gmc{2}{l}{AGE} &    \gmc{2}{c}{22,968} &        \gmc{2}{c}{15.96} &      \gmc{2}{c}{12.77} &       2.00 &        6.00 &       12.00 &       22.00 &       \gmc{2}{c}{56.00} \\
        \gmc{2}{l}{SG} &    \gmc{2}{c}{22,968} &         \gmc{2}{c}{0.16} &       \gmc{2}{c}{0.46} &      -0.54 &       -0.05 &        0.08 &        0.25 &        \gmc{2}{c}{2.08} \\
        \gmc{2}{l}{CAP} &    \gmc{2}{c}{22,968} &         \gmc{2}{c}{0.23} &       \gmc{2}{c}{0.16} &       0.01 &        0.10 &        0.19 &        0.33 &        \gmc{2}{c}{0.66} \\
        \gmc{2}{l}{LEV} &    \gmc{2}{c}{22,968} &         \gmc{2}{c}{2.08} &       \gmc{2}{c}{2.30} &      -3.67 &        1.30 &        1.68 &        2.39 &       \gmc{2}{c}{10.52} \\
        \gmc{2}{l}{GM} &    \gmc{2}{c}{22,968} &         \gmc{2}{c}{0.21} &       \gmc{2}{c}{1.16} &      -3.38 &        0.21 &        0.32 &        0.45 &        \gmc{2}{c}{0.82} \\
        \gmc{2}{l}{SGV} &    \gmc{2}{c}{22,968} &         \gmc{2}{c}{3.93} &       \gmc{2}{c}{8.86} &       0.17 &        0.38 &        0.72 &        2.56 &       \gmc{2}{c}{45.94} \\
        \gmc{2}{l}{CON} &    \gmc{2}{c}{22,968} &         \gmc{2}{c}{0.62} &       \gmc{2}{c}{0.48} &       0.00 &        0.00 &        1.00 &        1.00 &        \gmc{2}{c}{1.00} \\
        \gmc{2}{l}{ROA} &    \gmc{2}{c}{22,968} &        \gmc{2}{c}{-0.03} &       \gmc{2}{c}{0.25} &      -0.99 &       -0.07 &        0.03 &        0.09 &        \gmc{2}{c}{0.32} \\
        \gmc{2}{l}{ROE} &    \gmc{2}{c}{22,968} &        \gmc{2}{c}{-0.02} &       \gmc{2}{c}{0.58} &      -2.13 &       -0.12 &        0.07 &        0.17 &        \gmc{2}{c}{1.28} \\
        \gmc{2}{l}{IHLD} &    \gmc{2}{c}{22,968} &         \gmc{2}{c}{0.19} &       \gmc{2}{c}{0.13} &       0.00 &        0.09 &        0.17 &        0.27 &        \gmc{2}{c}{0.52} \\
        \gmc{2}{l}{AL} &    \gmc{2}{c}{22,968} &         \gmc{2}{c}{0.24} &       \gmc{2}{c}{0.43} &       0.00 &        0.00 &        0.00 &        0.00 &        \gmc{2}{c}{1.00} \\ \midrule

    \gmc{14}{l}{\textbf{Panel B: Sample Representation across Economic Sectors}}    \\\midrule
    \gmc{3}{l}{\textbf{Sector}} & \gmc{6}{c}{\textbf{N}} & \gmc{5}{c}{\textbf{\% Frequency}} \\\midrule
    \gmc{3}{l}{Energy} & \gmc{6}{c}{271} & \gmc{5}{c}{1.18\%}                       \\
    \gmc{3}{l}{Materials} & \gmc{6}{c}{1,785} & \gmc{5}{c}{7.77\%}                  \\
    \gmc{3}{l}{Industrials} & \gmc{6}{c}{4,334}   &     \gmc{5}{c}{18.87\%}             \\
    \gmc{3}{l}{Consumer Discretionary} & \gmc{6}{c}{3,889}  & \gmc{5}{c}{16.93\%}       \\
    \gmc{3}{l}{Consumer Staples} & \gmc{6}{c}{1,440} & \gmc{5}{c}{6.27\%}       \\
    \gmc{3}{l}{Health Care} & \gmc{6}{c}{4,002} & \gmc{5}{c}{17.42\%}               \\
    \gmc{3}{l}{Financials} & \gmc{6}{c}{9} & \gmc{5}{c}{0.04\%}             \\
    \gmc{3}{l}{Information Technology} & \gmc{6}{c}{7,236} & \gmc{5}{c}{31.50\%}        \\
    \gmc{3}{l}{Telecommunication Services} & \gmc{6}{c}{2} & \gmc{5}{c}{0.01\%} \\
    \gmc{3}{l}{Utilities} & \gmc{6}{c}{0} & \gmc{5}{c}{0.00\%}              \\\midrule
    \gmc{3}{l}{Total} & \gmc{6}{c}{22,968} & \gmc{5}{c}{100.00\%}               \\
    \midrule

    \gmc{14}{l}{\textbf{Panel C: Pearson (Spearman) Pairwise Correlations Above (Below) the Main Diagonal}} \\\midrule
    \textbf{ }& \textbf{CC}& \textbf{LOG MV}& \textbf{LOG AGE}& \textbf{SG}& \textbf{CAP}& \textbf{LEV}& \textbf{GM}& \textbf{SGV}& \textbf{CON}& \textbf{ROA}& \textbf{ROE}& \textbf{IHLD}& \textbf{AL}\\\midrule
            CC&       1.00&         -0.03&          -0.09&       0.10&       -0.09&       -0.04&      -0.18&        0.08&           0.04&       -0.16&       -0.07&        -0.17&           -0.03\\
         LOGMV&      -0.08&          1.00&           0.22&       0.09&       -0.04&        0.00&       0.01&        0.01&           0.29&        0.19&        0.15&        -0.39&           -0.31\\
        LOGAGE&      -0.11&          0.19&           1.00&      -0.20&        0.03&        0.03&       0.05&       -0.07&           0.32&        0.16&        0.10&         0.05&            0.08\\
            SG&       0.03&          0.15&          -0.17&       1.00&       -0.06&        0.00&      -0.04&        0.05&          -0.08&       -0.01&        0.04&        -0.08&           -0.12\\
           CAP&      -0.16&         -0.04&           0.06&      -0.03&        1.00&        0.08&       0.04&       -0.08&          -0.10&        0.11&        0.06&        -0.03&            0.10\\
           LEV&      -0.13&         -0.02&           0.11&      -0.02&        0.25&        1.00&       0.01&       -0.03&           0.00&        0.02&       -0.04&         0.06&           -0.04\\
            GM&      -0.12&          0.14&          -0.06&       0.10&       -0.25&       -0.24&       1.00&       -0.06&          -0.01&        0.25&        0.13&         0.13&            0.01\\
           SGV&       0.10&         -0.02&          -0.16&       0.08&       -0.13&       -0.13&       0.08&        1.00&          -0.08&       -0.09&       -0.05&        -0.10&           -0.05\\
          CON&       0.04&          0.28&           0.31&      -0.08&       -0.11&        0.02&       0.02&       -0.13&           1.00&       -0.03&        0.00&        -0.20&            0.04\\
           ROA&      -0.14&          0.27&           0.14&       0.30&        0.09&       -0.06&       0.25&       -0.15&          -0.04&        1.00&        0.46&         0.12&           -0.06\\
           ROE&      -0.11&          0.25&           0.14&       0.28&        0.10&        0.00&       0.18&       -0.14&          -0.02&        0.85&        1.00&         0.06&            0.06\\
          IHLD&      -0.18&         -0.39&           0.07&      -0.04&        0.08&        0.20&      -0.10&       -0.15&          -0.19&        0.11&        0.09&         1.00&            0.16\\
            AL&      -0.02&         -0.31&           0.09&      -0.17&        0.09&        0.01&      -0.19&       -0.13&           0.04&       -0.14&       -0.09&         0.16&            1.00\\
 \bottomrule
    \end{longtable}
        \vspace{-0.1in}\footnotesize \noindent \textit{Variable Definitions:} \\
         CC = level of customer-base concentration; \\
         NCUM = number of reported major customers; \\
         MV   = market value of equity (in millions);\\
         AGE  = firm age; \\
         SG   = annual percentage sales growth of the firm; \\
         CONGLO = an indicator variable equal to 1 if the firm reports at least two business segments; \\
         ROA  = ratio of income before extraordinary items to the beginning of year book value of total assets; \\
         ROE  = ratio of income before extraordinary items to the beginning of year book value of equity; \\
         IHLD = ratio of inventory to the book value of total assets; \\
         MANU = an indicator variable equal to 1 if the firm belongs to industrial sector (GSECTOR code 20); \\
         SMANU = an indicator variable equal to 1 if the SIC code is between 2000 and 3999;
         \medskip \hrule
    \endgroup


\end{document}
答案1

设置列的十进制对齐方式并将其设置为三个单独的表,因为面板之间没有对齐。
\documentclass[11pt]{article}
\usepackage{setspace}                                   %double spacing and spacing in tables
\usepackage{amsmath}                                    %equations etc. in latex
\usepackage[capposition=top]{floatrow}                  %so that the caption for figures appear at the top
\usepackage[tablename=TABLE,figurename = FIGURE,labelsep=newline,aboveskip=0pt,font=bf,justification=centering]{caption}   %so that caption looks cool
\usepackage{booktabs}                                   %midrule etc. which adds space around lines. Make tables look good.
\usepackage{tabularx}                                   %use tabularx environment for creating one page tables
\usepackage[margin=1in]{geometry}                       %defining the margin for the page
\usepackage[autostyle]{csquotes}                        %for quotes. alternative would be " and "
\usepackage[table]{xcolor}                              %rowcolor, cellcolor, color for references
\usepackage{pdflscape}                                  %landscape and keep the pages straight
\usepackage{everypage}                                  %For AddEveryHookPage
\usepackage{hanging}                                    %For references
\usepackage{longtable}                                  %For multiple pages
\usepackage{multirow}                                   %Valuable package as can be seen from table 5,8, and 10
\usepackage{graphicx}                                   %created line using this package
\usepackage{bm}                                         %bold and italics in the math enviornment at the same time
\usepackage{dcolumn} % a package actually used in this example

\makeatletter
\setlength{\@fptop}{0pt}                                %to make tables and figures start at the top of the page
\makeatother

\newcommand{\Lpagenumber}{\ifdim\textwidth=\linewidth\else\bgroup       %to correct the page numbering for landscape pages
    \dimendef\margin=0
    \ifodd\value{page}\margin=\oddsidemargin
    \else\margin=\evensidemargin
    \fi
    \raisebox{\dimexpr -\topmargin-\headheight-\headsep-0.5\linewidth}[0pt][0pt]{%
        \rlap{\hspace{\dimexpr \margin+\textheight+\footskip}%
stabu            \llap{\rotatebox{90}{\thepage}}}}%
    \egroup\fi}
\AddEverypageHook{\Lpagenumber}%                        %to correct the page numbering for landscape pages


\newcolumntype{Y}{>{\centering\arraybackslash}X}        %to center the columns for tabularx environment
\newcolumntype{Z}{>{\centering\arraybackslash}p{0.75in}}    %to center the columns for tabularx environment
\newcolumntype{K}{>{\centering\arraybackslash}p{0.3in}} %to center the columns for tabularx environment
\newcommand{\gmc}[3]{\multicolumn{#1}{@{}#2@{}}{#3}}    %short form for multicolumn
\doublespacing                                          %make lines double spaced


%\author{
%   Sumit Gupta \\ University of California at Berkeley \\ Haas School of Business \\ Berkeley, CA 94720 \\\\ Panos Patatoukas \\ University of California at Berkeley \\ Haas School of Business \\ Berkeley, CA 94720 \\\\ Richard Sloan \thanks{Address: U.C. Berkeley, Haas School of Business, 545 Student Services Building, Berkeley, CA 94720. Phone: (510) 643-1409. Web: https://sites.google.com/site/ykonchit. Email: [email protected].}\\
%   University of California at Berkeley\\ Haas School of Business \\
%   Berkeley, CA 94720 \\
%   }

\title{
        Customer Concentration and Internal Control Weaknesses \thanks{
        We gratefully acknowledge comments from
        }
}

\begin{document}
    \setcounter{page}{-1} %start numbering at page 3 (2 - n where n = -1)
    \maketitle
    \thispagestyle{empty} %suppress page number


        \newpage
%       \section{Introduction}

%Comments: I found that there might be industry specific news, and hence industry-adjusted returns might be the right thing to take care of. Also, how do we tease out the effect of other effects from opening bell ceremonies. If we are interested in establishing the causality effect, then we must remove those data points for which we had a firm-specific news on the same day as well.

    %\newpage
    %\begingroup % keep any font size changes local to group
    %\captionof{table}{Sample Selection and Descriptive Statistics}
    %\singlespacing
    %\small
    %\setlength\tabcolsep{6pt} %default
    %\renewcommand{\arraystretch}{1}

    %\begin{tabularx}{\linewidth}{@{}XKZZ*2{Y}KK*2{Y}@{}}
    %\toprule
    %Event & Anniversary & Celebration & Corporate Rebranding & IPO &  M\&A & NASDAQ Listing & NASDAQ Visit & Spinoff & Total %\\\midrule
    %Closing & 44 & 48 & 4 & 46 & 0 & 10 & 337 & 0 & 489 \\\\
    %Opening & 59 & 71 & 2 & 131 & 3 & 13 & 364 & 5 & 646 \\\\\midrule
    %Total & 103 & 119 & 6 & 177 & 3 & 23 & 701 & 5 & 1,135 \\
    %\end{tabularx}

    %\footnotesize \hrule\medskip
    %\textit{Notes:} This table reports summary data for all Opening and Closing Bell NASDAQ Stock Exchange events held from January 1, 2011 through September 30, 2015, for which there is data available in CRSP and Compustat databases. Bell ceremony events are categorized into 8 event types. IPO is when a firm is celebrating a recent initial public offering. Anniversary is when a firm is celebrating an anniversary of a special event. M\&A is when a firm is celebrating a recent merger or acquisition event. Corporate Rebranding is when a firm is celebrating a recent corporate rebranding. Spinoff is when a firm is celebrating a recent spinoff. NASDAQ Listing is when a firm is celebrating listing its' stock on NASDAQ. Celebration is when a firm is celebrating an event that is not an Anniversary, IPO, M\&A, Corporate Rebranding or a Spinoff. NASDAQ Visit is when a firm cannot be categorized into the other categories and the reason for firm participation in bell ceremony event is not known.  \medskip\hrule
    %\endgroup


    %   \newpage
    %   \begingroup % keep any font size changes local to group
    %   \captionof{table}{NASDAQ Bell Ceremony Events}
    %   \singlespacing
    %   \small
    %   \setlength\tabcolsep{6pt} %default
    %   \renewcommand{\arraystretch}{1}
    %
    %   \begin{tabularx}{\linewidth}{@{}XKZZ*2{Y}KK*2{Y}@{}}
    %       \toprule
    %       Event & Anniversary & Celebration & Corporate Rebranding & IPO &  M\&A & NASDAQ Listing & NASDAQ Visit & Spinoff & Total \\\midrule
    %       Closing & 44 & 48 & 4 & 46 & 0 & 10 & 337 & 0 & 489 \\\\
    %       Opening & 59 & 71 & 2 & 131 & 3 & 13 & 364 & 5 & 646 \\\\\midrule
    %       Total & 103 & 119 & 6 & 177 & 3 & 23 & 701 & 5 & 1,135 \\
    %   \end{tabularx}

    %   \footnotesize \hrule\medskip
    %   \textit{Notes:} This table reports summary data for all Opening and Closing Bell NASDAQ Stock Exchange events held from January 1, 2011 through September 30, 2015, for which there is data available in CRSP and Compustat databases. Bell ceremony events are categorized into 8 event types. IPO is when a firm is celebrating a recent initial public offering. Anniversary is when a firm is celebrating an anniversary of a special event. M\&A is when a firm is celebrating a recent merger or acquisition event. Corporate Rebranding is when a firm is celebrating a recent corporate rebranding. Spinoff is when a firm is celebrating a recent spinoff. NASDAQ Listing is when a firm is celebrating listing its' stock on NASDAQ. Celebration is when a firm is celebrating an event that is not an Anniversary, IPO, M\&A, Corporate Rebranding or a Spinoff. NASDAQ Visit is when a firm cannot be categorized into the other categories and the reason for firm participation in bell ceremony event is not known.  \medskip\hrule
    %   \endgroup

        \newpage
        \begingroup % keep any font size changes local to group
        \captionof{table}{Sample Selection}
        \singlespacing
        \small
        \setlength\tabcolsep{6pt} %default
        \renewcommand{\arraystretch}{1.25}

        \begin{tabularx}{\linewidth}{@{}p{13.5cm}Y@{}}
            \toprule
            \textbf{Sample Selection} & \textbf{Observations}\\\midrule
            \textbf{Panel A: Unique Supplier-Customer Linkages} \\\midrule
            Observations for major customers reported between 1976-2016 in Compustat Customer Segment File & 483,815\\
            \hspace{0.2in} Remove customers with a missing or non-identifiable identity & (295,383) \\\midrule

            Number of supplier-customer linkages used for calculating customer concentration & 188,432 \\\midrule\\\midrule

            \textbf{Panel B: Unique Firm-Year Observations} \\\midrule
            Firm-Year obervations obtained from supplier-customer linkage data in manufacturing industry & 41,122 \\
            \hspace{0.2in} Remove observations with missing values for customer concentration & (6,460) \\
            \hspace{0.2in} Remove non-positive total assets and revenue & (10) \\
            \hspace{0.2in} Remove observations with missing compustat variables  & (7,430) \\
            \hspace{0.2in} Remove observations with missing business segment data & (635) \\
            \hspace{0.2in} Trim continuous variables (except customer concentration) at 1\% and 99\% level & (3,619) \\\midrule
            Final Sample Size & 22,968
        \end{tabularx}

        \footnotesize \hrule
        \endgroup


\newpage
\begingroup % keep any font size changes local to group
%\setlength\tabcolsep{2pt} % default value: 6pt
\singlespacing
\footnotesize
\centering
\setlength\tabcolsep{3pt} %default
\renewcommand{\arraystretch}{0.99}


    \captionof{table}{\textbf{Descriptive Statistics}}

\textbf{Panel A: Empirical Distributions}

\begin{tabular*}{\textwidth}{@{\extracolsep{\fill}}lc*{7}{D..{4.2}}}
    \toprule
    \gmc{1}{l}{\textbf{Variables}} & \gmc{1}{c}{\textbf{N}} & \gmc{1}{c}{\textbf{Mean}} & \gmc{1}{c}{\textbf{SD}} & \gmc{1}{c}{\textbf{P1}} & \gmc{1}{c}{\textbf{P25}} & \gmc{1}{c}{\textbf{P50}} & \gmc{1}{c}{\textbf{P75}} & \gmc{1}{c}{\textbf{P99}} \\\midrule
        CC &    22,968 &         0.12 &       0.23 &       0.00 &        0.02 &        0.05 &        0.13 &        0.94 \\
        MV &    22,968 &      1015.04 &    4323.21 &       1.09 &       20.29 &       82.83 &      393.92 &    19628.09 \\
        AGE &    22,968 &        15.96 &      12.77 &       2.00 &        6.00 &       12.00 &       22.00 &       56.00 \\
        SG &    22,968 &         0.16 &       0.46 &      -0.54 &       -0.05 &        0.08 &        0.25 &        2.08 \\
        CAP &    22,968 &         0.23 &       0.16 &       0.01 &        0.10 &        0.19 &        0.33 &        0.66 \\
        LEV &    22,968 &         2.08 &       2.30 &      -3.67 &        1.30 &        1.68 &        2.39 &       10.52 \\
        GM &    22,968 &         0.21 &       1.16 &      -3.38 &        0.21 &        0.32 &        0.45 &        0.82 \\
        SGV &    22,968 &         3.93 &       8.86 &       0.17 &        0.38 &        0.72 &        2.56 &       45.94 \\
        CON &    22,968 &         0.62 &       0.48 &       0.00 &        0.00 &        1.00 &        1.00 &        1.00 \\
        ROA &    22,968 &        -0.03 &       0.25 &      -0.99 &       -0.07 &        0.03 &        0.09 &        0.32 \\
        ROE &    22,968 &        -0.02 &       0.58 &      -2.13 &       -0.12 &        0.07 &        0.17 &        1.28 \\
        IHLD &    22,968 &         0.19 &       0.13 &       0.00 &        0.09 &        0.17 &        0.27 &        0.52 \\
        AL &    22,968 &         0.24 &       0.43 &       0.00 &        0.00 &        0.00 &        0.00 &        1.00 \\ \midrule
\end{tabular*}


\textbf{Panel B: Sample Representation across Economic Sectors}

\begin{tabular*}{\textwidth}{@{\extracolsep{\fill}}lD..{5.0}D..{2.3}}
    \gmc{1}{l}{\textbf{Sector}} & \gmc{1}{c}{\textbf{N}} & \gmc{1}{c}{\textbf{\% Frequency}} \\\midrule
    Energy & 271 & 1.18\%                       \\
    Materials & 1,785 & 7.77\%                  \\
    Industrials & 4,334   &     18.87\%             \\
    Consumer Discretionary & 3,889  & 16.93\%       \\
    Consumer Staples & 1,440 & 6.27\%       \\
    Health Care & 4,002 & 17.42\%               \\
    Financials & 9 & 0.04\%             \\
    Information Technology & 7,236 & 31.50\%        \\
    Telecommunication Services & 2 & 0.01\% \\
    Utilities & 0 & 0.00\%              \\\midrule
    Total & 22,968 & 100.00\%               \\
    \midrule
\end{tabular*}


\textbf{Panel C: Pearson (Spearman) Pairwise Correlations Above (Below) the Main Diagonal}

\tiny
\begin{tabular*}{\textwidth}{@{\extracolsep{\fill}}lc*{12}{D..{4.2}}}


    \textbf{ }& \gmc{1}{c}{\textbf{CC}}& \gmc{1}{c}{\textbf{LOG MV}}& \gmc{1}{c}{\textbf{LOG AGE}}& \gmc{1}{c}{\textbf{SG}}& \gmc{1}{c}{\textbf{CAP}}& \gmc{1}{c}{\textbf{LEV}}& \gmc{1}{c}{\textbf{GM}}& \gmc{1}{c}{\textbf{SGV}}& \gmc{1}{c}{\textbf{CON}}& \gmc{1}{c}{\textbf{ROA}}& \gmc{1}{c}{\textbf{ROE}}& \gmc{1}{c}{\textbf{IHLD}}& \gmc{1}{c}{\textbf{AL}}\\\midrule
            CC&       1.00&         -0.03&          -0.09&       0.10&       -0.09&       -0.04&      -0.18&        0.08&           0.04&       -0.16&       -0.07&        -0.17&           -0.03\\
         LOGMV&      -0.08&          1.00&           0.22&       0.09&       -0.04&        0.00&       0.01&        0.01&           0.29&        0.19&        0.15&        -0.39&           -0.31\\
        LOGAGE&      -0.11&          0.19&           1.00&      -0.20&        0.03&        0.03&       0.05&       -0.07&           0.32&        0.16&        0.10&         0.05&            0.08\\
            SG&       0.03&          0.15&          -0.17&       1.00&       -0.06&        0.00&      -0.04&        0.05&          -0.08&       -0.01&        0.04&        -0.08&           -0.12\\
           CAP&      -0.16&         -0.04&           0.06&      -0.03&        1.00&        0.08&       0.04&       -0.08&          -0.10&        0.11&        0.06&        -0.03&            0.10\\
           LEV&      -0.13&         -0.02&           0.11&      -0.02&        0.25&        1.00&       0.01&       -0.03&           0.00&        0.02&       -0.04&         0.06&           -0.04\\
            GM&      -0.12&          0.14&          -0.06&       0.10&       -0.25&       -0.24&       1.00&       -0.06&          -0.01&        0.25&        0.13&         0.13&            0.01\\
           SGV&       0.10&         -0.02&          -0.16&       0.08&       -0.13&       -0.13&       0.08&        1.00&          -0.08&       -0.09&       -0.05&        -0.10&           -0.05\\
          CON&       0.04&          0.28&           0.31&      -0.08&       -0.11&        0.02&       0.02&       -0.13&           1.00&       -0.03&        0.00&        -0.20&            0.04\\
           ROA&      -0.14&          0.27&           0.14&       0.30&        0.09&       -0.06&       0.25&       -0.15&          -0.04&        1.00&        0.46&         0.12&           -0.06\\
           ROE&      -0.11&          0.25&           0.14&       0.28&        0.10&        0.00&       0.18&       -0.14&          -0.02&        0.85&        1.00&         0.06&            0.06\\
          IHLD&      -0.18&         -0.39&           0.07&      -0.04&        0.08&        0.20&      -0.10&       -0.15&          -0.19&        0.11&        0.09&         1.00&            0.16\\
            AL&      -0.02&         -0.31&           0.09&      -0.17&        0.09&        0.01&      -0.19&       -0.13&           0.04&       -0.14&       -0.09&         0.16&            1.00\\
 \bottomrule
    \end{tabular*}

\bigskip

        \footnotesize \raggedright
 \textit{Variable Definitions:} \\
         CC = level of customer-base concentration; \\
         NCUM = number of reported major customers; \\
         MV   = market value of equity (in millions);\\
         AGE  = firm age; \\
         SG   = annual percentage sales growth of the firm; \\
         CONGLO = an indicator variable equal to 1 if the firm reports at least two business segments; \\
         ROA  = ratio of income before extraordinary items to the beginning of year book value of total assets; \\
         ROE  = ratio of income before extraordinary items to the beginning of year book value of equity; \\
         IHLD = ratio of inventory to the book value of total assets; \\
         MANU = an indicator variable equal to 1 if the firm belongs to industrial sector (GSECTOR code 20); \\
         SMANU = an indicator variable equal to 1 if the SIC code is between 2000 and 3999;
         \medskip \hrule
    \endgroup


\end{document}