

我如何在 Latex 中创建类似的东西?我是 Latex 新手。我尝试使用流程图包创建类似的东西,但不知道如何创建第二张图片。
这就是给我第一张图片的文字。
\begin{tikzpicture}ultra thick, scale = 0.75, transform shape,font=\Large]
\tikzstyle{myarrows}=[line width=1mm,-triangle 45,postaction={draw, line   width=3mm, shorten >=4mm, -}]
\node[rectangle] (a1) [draw, minimum width=5 cm,minimum height=1cm] {event address};
\node[rectangle] (a2) [draw, minimum width=2.5 cm,minimum height=1cm,below of=a1,node distance=2cm] {in mapper};

\node[name=data, rectangle split,
rectangle split horizontal,
rectangle split parts=4,
below of=a2
rectangle split draw splits=true,
draw, minimum width=15 cm,minimum height=1cm,
label={[fill=white,inner sep=0pt,font=\footnotesize]},
align=center,
text width=5em,
inner sep=3pt,
font=\footnotesize ]  [below = of a2]
{virtual chip address\nodepart{two}mapped event address ~
\nodepart{three}0000000 ~
\nodepart{four}p~};
\draw [myarrows](a1)--(a2);
\draw [myarrows](a2)--(data);
\end{tikzpicture}
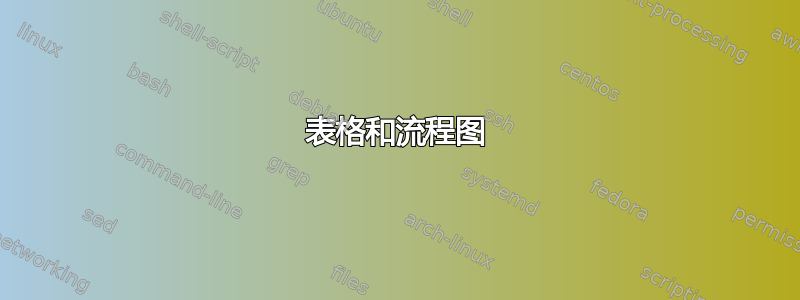
 但我想要像下面这样。我不知道如何用虚线划分最后一个框,如图所示,以及如何在矩形上插入文本,如图所示。

答案1
我将从矩阵的末尾开始,然后使用节点作为箭头。
\documentclass[tikz,border=10pt,10pt]{standalone}
\usetikzlibrary{shadows,positioning,matrix,fit,shapes.arrows,backgrounds}
\begin{document}
\begin{tikzpicture}
  [
    font=\Large\sffamily,
    my arrow/.style={ultra thick, single arrow, minimum height=20mm-.25\pgflinewidth, minimum width=7.5mm, anchor=south, shape border uses incircle, shape border rotate=-90, draw},
  ]
  \matrix (m) [matrix of nodes, nodes in empty cells, every node/.style={inner ysep=5pt, inner xsep=10pt}]
  {
    virtual chip address && mapped event address &&  0000000 & p\\
    & routing key &&& \phantom{p}header &\\
  };
  \scoped[on background layer]{\node (f) [draw, fill=white, drop shadow, ultra thick, fit=(m-1-1) (m-2-6) (m-1-6) (m-2-2)] {};}
  \draw [ultra thick] (f.north -| m-1-4) coordinate (c) node [above] {7 8} -- (f.south -| m-1-4);
  \draw [densely dotted, thick] (f.west |- m-1-1.south) -- (f.east |- m-1-1.south) (f.north -| m-1-6.west) node [above] {9 0} -- (m-1-1.south -| m-1-6.west);
  \path (f.north -| m-1-2) node [above] {34 56} (f.north west) node [above right] {12};
  \begin{scope}[every node/.style={fill=white, drop shadow}]
    \begin{scope}[every node/.append style={draw, ultra thick, minimum height=10mm}, node distance=20mm]
      \node (p) [above=of f.north, minimum width=25mm, drop shadow, fill=white] {in\textunderscore mapper};
      \node (e) [above=of p, minimum width=50mm] {event address};
    \end{scope}
    \node [my arrow] at (p.north) {};
    \node [my arrow] at (f.north) {};
  \end{scope}
  \path (e.north west) node [above right] {12} (e.north east) node [above left] {3};
\end{tikzpicture}
\end{document}
