

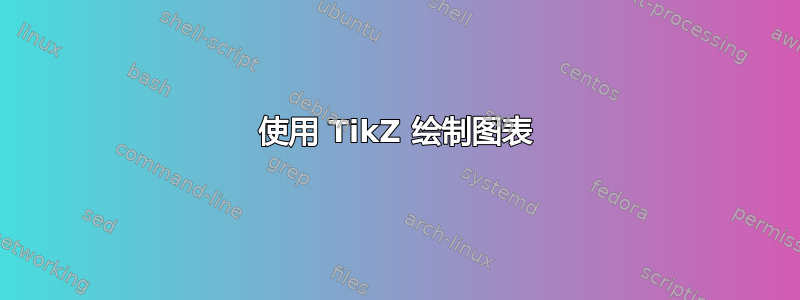
我正在尝试绘制下图

使用 TikZ。这是我的 MWE
\documentclass[10pt]{article}
\usepackage{pgf,tikz}
\usetikzlibrary{arrows}
\pagestyle{empty}
\begin{document}
\centering
\begin{tikzpicture}[%
line cap=round,
line join=round,
>=triangle 45,
x=1.0cm,
y=1.0cm%
][htb!]
\clip(-6,-4) rectangle (6,4);
\draw [line width=0.5pt] (0.,4)-- (0,0);
\draw [line width=0.5pt] (0,0.)-- (6,0.);
\draw [blue,line width=1.2pt] (0,0.)-- (3,0.);
\draw [red, dashed,line width=1.2pt] (3,0.)-- (6,0.);
\draw [blue, thick, domain=2:3] plot (\x, {1.44+1.5*(-2+\x)^(1/2)});
\draw [red, dashed,thick, domain=2:3] plot (\x, {1.44-1.5*(-2+\x)^(1/2)});
\end{tikzpicture}
\end{document}
答案1
我会使用pgfplots。你绘制的抛物线显然与图像中显示的抛物线不同,但我还没有尝试计算出正确的方程。这个就留给你了。
我在代码中添加了一些注释。
关于compat设置,看看\pgfplotsset{compat=newest} 的注意事项和“以向后兼容模式运行”是什么意思?我应该修复什么才能摆脱它?很有用。

\documentclass[border=5mm]{standalone}
\usepackage{mathrsfs} % provides \mathscr
\usepackage{pgfplots}

\begin{document}
\begin{tikzpicture}[
  % define two styles to use for the different parts of the plot
  stable/.style={blue,very thick},
  unstable/.style={stable,densely dashed},
  % for the nodes
  desc/.style={font=\footnotesize,black}
]
\begin{axis}[
 % set domain -- starts at 0.44 because you can't have square roots of negative numbers
 domain=0.44:1,
 % number of samples for plots
 samples=100,
 % default is axis lines on all four sides
 axis lines=left,
 % specify axis limits
 ymin=0,
 xmin=0.3,xmax=1.35,
 % add axis labels
 ylabel={Force of inflection},
 xlabel={$\mathscr{R}_0$},
]

% plot upper part of parabola
\addplot [stable] {0.374+0.5*(-0.44+x)^(1/2)}
  % add a node 80% along the way of the parabola
   node[above left,pos=0.6,desc,align=left] {Stable endemic\\equilibrium};
% plot lower part of parabola
\addplot [unstable] {0.374-0.5*(-0.44+x)^(1/2)}
  % and add node again
  node[above right,pos=0.3,desc] {Unstable endemic equilibrium};


% draw the solid line for "stable DFE"
\draw [
 % use same style as for plot
 stable]
 % rel axis cs: means that (0,0) is the lower left corner of the axis, and (1,1) the upper right
 % axis cs: means that axis coordinates are used
 % with \pgfplotsset{compat=1.11} or newer, axis:cs is the default, and then you don't need to say it explicitly
 (rel axis cs:0,0) -- (axis cs:1,0)
  node [above,pos=0.3,desc] {Stable DFE};

% draw line for unstable DFE.
\draw [unstable] (rel axis cs:1,0) -- (axis cs:1,0)
  node [above,pos=0.5,desc] {Unstable DFE};
\end{axis}
\end{tikzpicture}
\end{document}