

我有一个组图,但我想在同一tikzfigure环境中注释最终的 pgfplots 图,我想知道这是否可行。到目前为止,我拥有的是
\documentclass[border={10pt 10pt 10pt 10pt}]{standalone}

\usepackage{tikz}
\usepackage{pgfplots}
\usetikzlibrary{pgfplots.groupplots}

\begin{document}

\begin{tikzpicture}

\begin{groupplot}[
    group style={
        group name=my plots,
        group size=4 by 3,
    },
        tick style={draw=none},
        ticks=none,
        ]

\nextgroupplot[]
\addplot3[surf, domain=0:1,y domain=0:1] {x};

\nextgroupplot[]
\addplot3[surf, domain=0:1,y domain=0:1] {y};

\nextgroupplot[]
\addplot3[surf, domain=0:1,y domain=0:1] {x*y};

\nextgroupplot[group/empty plot]

\nextgroupplot[]
\addplot3[surf, domain=0:1,y domain=0:1] {x^2};

\nextgroupplot[]
\addplot3[surf, domain=0:1,y domain=0:1] {y*2};

\nextgroupplot[]
\addplot3[surf, domain=0:1,y domain=0:1] {x^2*y^2)};

\nextgroupplot[group/empty plot]

\nextgroupplot[]
\addplot3[surf, domain=0:1,y domain=0:1] {x^3};

\nextgroupplot[]
\addplot3[surf, domain=0:1,y domain=0:1] {y^4};

\nextgroupplot[]
\addplot3[surf, domain=0:1,y domain=0:1] {x^2*y};

\nextgroupplot[]
\addplot3[surf, domain=0:1,y domain=0:1] {x*y^2};

\end{groupplot}
\end{tikzpicture}

\end{document}
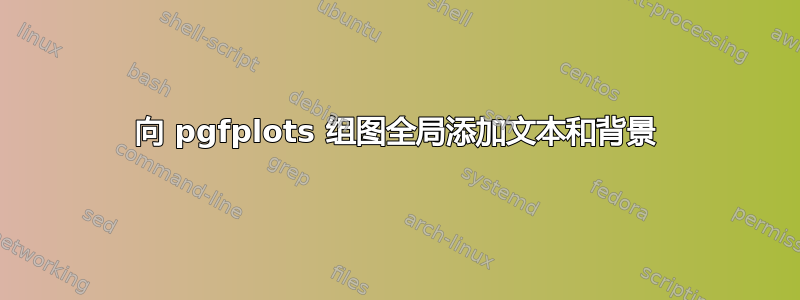
我希望最终的数字是这样的

其中有一组图形(灰色框)的背景,并且该背景可以有圆角,并且情节中的其他地方还有文本。
答案1
那么,您正在寻找类似以下内容的内容?
% used PGFPlots v1.15
\documentclass[border=10pt]{standalone}
\usepackage{pgfplots}
    \usetikzlibrary{
        backgrounds,
        pgfplots.groupplots,
    }
\begin{document}
\begin{tikzpicture}

    % draw the plots
    \begin{groupplot}[
        group style={
            group name=my plots,
            group size=4 by 3,
        },
        tick style={draw=none},
        ticks=none,
    ]
    \nextgroupplot[]
        \addplot3[surf, domain=0:1,y domain=0:1] {x};
    \nextgroupplot[]
        \addplot3[surf, domain=0:1,y domain=0:1] {y};
    \nextgroupplot[]
        \addplot3[surf, domain=0:1,y domain=0:1] {x*y};
    \nextgroupplot[group/empty plot]
    \nextgroupplot[]
        \addplot3[surf, domain=0:1,y domain=0:1] {x^2};
    \nextgroupplot[]
        \addplot3[surf, domain=0:1,y domain=0:1] {y*2};
    \nextgroupplot[]
        \addplot3[surf, domain=0:1,y domain=0:1] {x^2*y^2)};
    \nextgroupplot[group/empty plot]
    \nextgroupplot[]
        \addplot3[surf, domain=0:1,y domain=0:1] {x^3};
    \nextgroupplot[]
        \addplot3[surf, domain=0:1,y domain=0:1] {y^4};
    \nextgroupplot[]
        \addplot3[surf, domain=0:1,y domain=0:1] {x^2*y};
    \nextgroupplot[]
        \addplot3[surf, domain=0:1,y domain=0:1] {x*y^2};
    \end{groupplot}

    % draw the text nodes
    \node at (my plots c4r1) {text1};
    \node [
        % change node dimensions to fit the size of the plots
        % (Since the axis width and height weren't changed they are still
        %  the default values. But you didn't draw any axis labels, so the
        %  extra reserved space for that isn't needed (see the manual).)
        text width=\axisdefaultwidth - 45pt,
        minimum width=\axisdefaultwidth - 45pt,
        minimum height=\axisdefaultheight - 45pt,
        align=justify,
%        % ---------------------------------------------------------------------
%        % for debugging purposes only
%        draw,
%        % ---------------------------------------------------------------------
    ] at (my plots c4r2) {
        this is a bit lengthier text to show that you are not limited to
        some short stuff here.
    };

    % draw the background rectangles
    \begin{scope}[
        on background layer,
        rounded corners=15pt,
    ]
            \pgfmathsetlengthmacro{\Shift}{10pt}
        \fill [black!10]
            ([shift={(-\Shift,\Shift)}] my plots c1r1.north west)
                rectangle
            ([shift={(\Shift,-\Shift)}] my plots c2r2.south east)
        ;
        \fill [blue!50!red!25!white]
            ([shift={(-\Shift,\Shift)}] my plots c4r3.north west)
                rectangle
            ([shift={(\Shift,-\Shift)}] my plots c4r3.south east)
        ;
    \end{scope}

\end{tikzpicture}
\end{document}
