

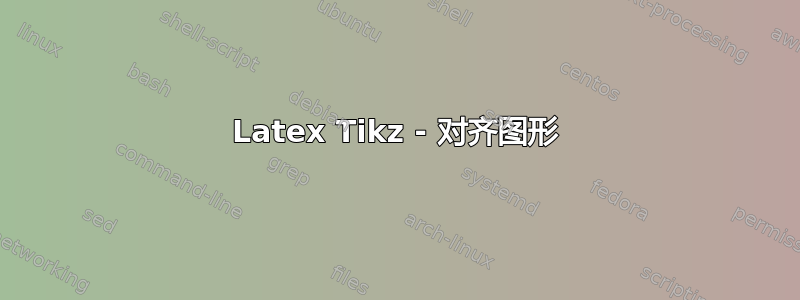
我想对齐两个图形,使小图形的右上角位于大图形的右上角。怎么做?我还希望在缩放大图形时,小图形会自动改变位置以保持在右上角。

\documentclass{article}
\usepackage{pgfplots}
\usepackage{filecontents}
%\pgfplotsset{width=10cm,compat=newest}
\usepgfplotslibrary{units}
\usetikzlibrary{spy,backgrounds}
\usepackage{pgfplotstable}
\begin{filecontents*}{data.csv}
a,b
-9.424778,-0.000000
-9.414778,-0.010000
-9.404778,-0.019999
-9.394778,-0.029996
-9.384778,-0.039989
-9.374778,-0.049979
-9.364778,-0.059964
-9.354778,-0.069943
-9.344778,-0.079915
-9.334778,-0.089879
-9.324778,-0.099833
-9.314778,-0.109778
-9.304778,-0.119712
-9.294778,-0.129634
-9.284778,-0.139543
-9.274778,-0.149438
-9.264778,-0.159318
-9.254778,-0.169182
-9.244778,-0.179030
-9.234778,-0.188859
-9.224778,-0.198669
-9.214778,-0.208460
-9.204778,-0.218230
-9.194778,-0.227978
-9.184778,-0.237703
-9.174778,-0.247404
-9.164778,-0.257081
-9.154778,-0.266731
-9.144778,-0.276356
-9.134778,-0.285952
-9.124778,-0.295520
-9.114778,-0.305059
-9.104778,-0.314567
-9.094778,-0.324043
-9.084778,-0.333487
-9.074778,-0.342898
-9.064778,-0.352274
-9.054778,-0.361615
-9.044778,-0.370920
-9.034778,-0.380188
-9.024778,-0.389418
-9.014778,-0.398609
-9.004778,-0.407760
-8.994778,-0.416871
-8.984778,-0.425939
-8.974778,-0.434966
-8.964778,-0.443948
-8.954778,-0.452886
-8.944778,-0.461779
-8.934778,-0.470626
-8.924778,-0.479426
-8.914778,-0.488177
-8.904778,-0.496880
-8.894778,-0.505533
-8.884778,-0.514136
-8.874778,-0.522687
-8.864778,-0.531186
-8.854778,-0.539632
-8.844778,-0.548024
-8.834778,-0.556361
-8.824778,-0.564642
-8.814778,-0.572867
-8.804778,-0.581035
-8.794778,-0.589145
-8.784778,-0.597195
-8.774778,-0.605186
-8.764778,-0.613117
-8.754778,-0.620986
-8.744778,-0.628793
-8.734778,-0.636537
-8.724778,-0.644218
-8.714778,-0.651834
-8.704778,-0.659385
-8.694778,-0.666870
-8.684778,-0.674288
-8.674778,-0.681639
-8.664778,-0.688921
-8.654778,-0.696135
-8.644778,-0.703279
-8.634778,-0.710353
-8.624778,-0.717356
-8.614778,-0.724287
-8.604778,-0.731146
-8.594778,-0.737931
-8.584778,-0.744643
-8.574778,-0.751280
-8.564778,-0.757843
-8.554778,-0.764329
-8.544778,-0.770739
-8.534778,-0.777072
-8.524778,-0.783327
-8.514778,-0.789504
-8.504778,-0.795602
-8.494778,-0.801620
-8.484778,-0.807558
-8.474778,-0.813416
-8.464778,-0.819192
-8.454778,-0.824886
-8.444778,-0.830497
-8.434778,-0.836026
-8.424778,-0.841471
-8.414778,-0.846832
-8.404778,-0.852108
-8.394778,-0.857299
-8.384778,-0.862404
-8.374778,-0.867423
-8.364778,-0.872355
-8.354778,-0.877201
-8.344778,-0.881958
-8.334778,-0.886627
-8.324778,-0.891207
-8.314778,-0.895699
-8.304778,-0.900100
-8.294778,-0.904412
-8.284778,-0.908633
-8.274778,-0.912764
-8.264778,-0.916803
-8.254778,-0.920751
-8.244778,-0.924606
-8.234778,-0.928369
-8.224778,-0.932039
-8.214778,-0.935616
-8.204778,-0.939099
-8.194778,-0.942489
-8.184778,-0.945784
-8.174778,-0.948985
-8.164778,-0.952090
-8.154778,-0.955101
-8.144778,-0.958016
-8.134778,-0.960835
-8.124778,-0.963558
-8.114778,-0.966185
-8.104778,-0.968715
-8.094778,-0.971148
-8.084778,-0.973485
-8.074778,-0.975723
-8.064778,-0.977865
-8.054778,-0.979908
-8.044778,-0.981854
-8.034778,-0.983701
-8.024778,-0.985450
-8.014778,-0.987100
-8.004778,-0.988652
-7.994778,-0.990105
-7.984778,-0.991458
-7.974778,-0.992713
\end{filecontents*}
\begin{document}
\tikzstyle{input} = [coordinate]
\begin{figure}
\centering
\begin{tikzpicture}[scale=0.6]
    \begin{axis}[
        %width=0.4\textwidth,
        %height=0.4\textwidth,
        y tick label style={
            /pgf/number format/.cd,
                fixed,
                fixed zerofill,
                precision=2,
            /tikz/.cd
        },
        x tick label style={
            /pgf/number format/.cd,
                fixed,
                fixed zerofill,
                precision=2,
            /tikz/.cd
        },
        xmin=-10,
        xmax=10,
        xlabel={$Time[s]$},
        xlabel near ticks,
        ylabel={$Amplitude$},
        ylabel near ticks,
        xmajorgrids=true,
        ymajorgrids=true,
        name=MainPlot]
         \addplot[line width=2pt,solid]
           table [x index=0, y index=1, col
sep=comma] {data.csv};
    \end{axis}
    \node[pin={[pin edge={transparent}]100:{
        \begin{tikzpicture}[scale=0.6]
            \begin{axis}[
                y tick label style={
                    /pgf/number format/.cd,
                        fixed,
                        fixed zerofill,
                        precision=2,
                    /tikz/.cd
                },
                x tick label style={
                    /pgf/number format/.cd,
                        fixed,
                        fixed zerofill,
                        precision=2,
                    /tikz/.cd
                },
                tiny,
                yticklabel style = {font=\normalsize},
                xticklabel style = {font=\normalsize},
                xticklabel pos=upper,
                xmin=-6,
                xtick distance=1,
                xmax=-4,
                %xlabel={\normalsize $Time[s]$},
                xlabel near ticks,
                yticklabel pos=right,
                ymin=0.8,
                ytick distance=0.05,
                ymax=1,
                %ylabel={\normalsize $Amplitude$},
                ylabel near ticks,
                enlargelimits,
                axis background/.style={fill=white!10},
                xmajorgrids=true,
                ymajorgrids=true]
            \addplot [line width=2pt,solid]
           table [x index=0, y index=1, col sep=comma] {data.csv};
        \end{axis}
    \end{tikzpicture}
        }}]  {};
\end{tikzpicture}
\end{figure}
\end{document}
答案1
将 tikzpicture 放入 tikzpicture 中的常用方法是使用保存框。使用基线可以轻松进行垂直对齐,但没有水平对齐机制。因此,我计算了从中心到网格右上角的偏移量。请注意,这些偏移量需要按与 tikzpicture 相同的因子进行缩放。
请注意,数据只到 -7,因此大部分图表都缺失了。

\documentclass{article}
\usepackage{pgfplots}
\usepackage{filecontents}
%\pgfplotsset{width=10cm,compat=newest}
\usepgfplotslibrary{units}
\usetikzlibrary{spy,backgrounds}
\usepackage{pgfplotstable}
\begin{filecontents*}{data.csv}
a,b
-9.424778,-0.000000
-9.414778,-0.010000
-9.404778,-0.019999
-9.394778,-0.029996
-9.384778,-0.039989
-9.374778,-0.049979
-9.364778,-0.059964
-9.354778,-0.069943
-9.344778,-0.079915
-9.334778,-0.089879
-9.324778,-0.099833
-9.314778,-0.109778
-9.304778,-0.119712
-9.294778,-0.129634
-9.284778,-0.139543
-9.274778,-0.149438
-9.264778,-0.159318
-9.254778,-0.169182
-9.244778,-0.179030
-9.234778,-0.188859
-9.224778,-0.198669
-9.214778,-0.208460
-9.204778,-0.218230
-9.194778,-0.227978
-9.184778,-0.237703
-9.174778,-0.247404
-9.164778,-0.257081
-9.154778,-0.266731
-9.144778,-0.276356
-9.134778,-0.285952
-9.124778,-0.295520
-9.114778,-0.305059
-9.104778,-0.314567
-9.094778,-0.324043
-9.084778,-0.333487
-9.074778,-0.342898
-9.064778,-0.352274
-9.054778,-0.361615
-9.044778,-0.370920
-9.034778,-0.380188
-9.024778,-0.389418
-9.014778,-0.398609
-9.004778,-0.407760
-8.994778,-0.416871
-8.984778,-0.425939
-8.974778,-0.434966
-8.964778,-0.443948
-8.954778,-0.452886
-8.944778,-0.461779
-8.934778,-0.470626
-8.924778,-0.479426
-8.914778,-0.488177
-8.904778,-0.496880
-8.894778,-0.505533
-8.884778,-0.514136
-8.874778,-0.522687
-8.864778,-0.531186
-8.854778,-0.539632
-8.844778,-0.548024
-8.834778,-0.556361
-8.824778,-0.564642
-8.814778,-0.572867
-8.804778,-0.581035
-8.794778,-0.589145
-8.784778,-0.597195
-8.774778,-0.605186
-8.764778,-0.613117
-8.754778,-0.620986
-8.744778,-0.628793
-8.734778,-0.636537
-8.724778,-0.644218
-8.714778,-0.651834
-8.704778,-0.659385
-8.694778,-0.666870
-8.684778,-0.674288
-8.674778,-0.681639
-8.664778,-0.688921
-8.654778,-0.696135
-8.644778,-0.703279
-8.634778,-0.710353
-8.624778,-0.717356
-8.614778,-0.724287
-8.604778,-0.731146
-8.594778,-0.737931
-8.584778,-0.744643
-8.574778,-0.751280
-8.564778,-0.757843
-8.554778,-0.764329
-8.544778,-0.770739
-8.534778,-0.777072
-8.524778,-0.783327
-8.514778,-0.789504
-8.504778,-0.795602
-8.494778,-0.801620
-8.484778,-0.807558
-8.474778,-0.813416
-8.464778,-0.819192
-8.454778,-0.824886
-8.444778,-0.830497
-8.434778,-0.836026
-8.424778,-0.841471
-8.414778,-0.846832
-8.404778,-0.852108
-8.394778,-0.857299
-8.384778,-0.862404
-8.374778,-0.867423
-8.364778,-0.872355
-8.354778,-0.877201
-8.344778,-0.881958
-8.334778,-0.886627
-8.324778,-0.891207
-8.314778,-0.895699
-8.304778,-0.900100
-8.294778,-0.904412
-8.284778,-0.908633
-8.274778,-0.912764
-8.264778,-0.916803
-8.254778,-0.920751
-8.244778,-0.924606
-8.234778,-0.928369
-8.224778,-0.932039
-8.214778,-0.935616
-8.204778,-0.939099
-8.194778,-0.942489
-8.184778,-0.945784
-8.174778,-0.948985
-8.164778,-0.952090
-8.154778,-0.955101
-8.144778,-0.958016
-8.134778,-0.960835
-8.124778,-0.963558
-8.114778,-0.966185
-8.104778,-0.968715
-8.094778,-0.971148
-8.084778,-0.973485
-8.074778,-0.975723
-8.064778,-0.977865
-8.054778,-0.979908
-8.044778,-0.981854
-8.034778,-0.983701
-8.024778,-0.985450
-8.014778,-0.987100
-8.004778,-0.988652
-7.994778,-0.990105
-7.984778,-0.991458
-7.974778,-0.992713
\end{filecontents*}

\newlength{\xshift}% reserve global names
\newlength{\yshift}

\begin{document}
\tikzstyle{input} = [coordinate]
\begin{figure}
\sbox0{\begin{tikzpicture}[scale=0.6]
            \begin{axis}[name=grid,
                y tick label style={
                    /pgf/number format/.cd,
                        fixed,
                        fixed zerofill,
                        precision=2,
                    /tikz/.cd
                },
                x tick label style={
                    /pgf/number format/.cd,
                        fixed,
                        fixed zerofill,
                        precision=2,
                    /tikz/.cd
                },
                tiny,
                yticklabel style = {font=\normalsize},
                xticklabel style = {font=\normalsize},
                xticklabel pos=upper,
                xmin=-6,
                xtick distance=1,
                xmax=-4,
                %xlabel={\normalsize $Time[s]$},
                xlabel near ticks,
                yticklabel pos=right,
                ymin=0.8,
                ytick distance=0.05,
                ymax=1,
                %ylabel={\normalsize $Amplitude$},
                ylabel near ticks,
                enlargelimits,
                axis background/.style={fill=white!10},
                xmajorgrids=true,
                ymajorgrids=true]
            \addplot [line width=2pt,solid]
           table [x index=0, y index=1, col sep=comma] {data.csv};
        \end{axis}
        \pgfextractx{\xshift}{\pgfpointdiff{\pgfpointanchor{grid}{north east}}%
          {\pgfpointanchor{current bounding box}{center}}}
        \pgfextracty{\yshift}{\pgfpointdiff{\pgfpointanchor{grid}{north east}}%
          {\pgfpointanchor{current bounding box}{center}}}
        \global\xshift=\xshift
        \global\yshift=\yshift
\end{tikzpicture}}
\centering
\begin{tikzpicture}[scale=0.6]
    \begin{axis}[
        %width=0.4\textwidth,
        %height=0.4\textwidth,
        y tick label style={
            /pgf/number format/.cd,
                fixed,
                fixed zerofill,
                precision=2,
            /tikz/.cd
        },
        x tick label style={
            /pgf/number format/.cd,
                fixed,
                fixed zerofill,
                precision=2,
            /tikz/.cd
        },
        xmin=-10,
        xmax=10,
        xlabel={$Time[s]$},
        xlabel near ticks,
        ylabel={$Amplitude$},
        ylabel near ticks,
        xmajorgrids=true,
        ymajorgrids=true,
        name=MainPlot]
         \addplot[line width=2pt,solid]
           table [x index=0, y index=1, col sep=comma] {data.csv};
    \end{axis}
    \node[xshift=0.6\xshift,yshift=0.6\yshift] at(MainPlot.north east) {\usebox0};
\end{tikzpicture}
\end{figure}
\end{document}