

以下是我的问题的 MWE:
\documentclass[tikz]{standalone}
\usetikzlibrary{positioning}
\usetikzlibrary{quotes}
\RequirePackage{luatex85}

\begin{document}
\def\a{1cm}
\begin{tikzpicture}[
  large block/.style={draw,rectangle,minimum width=\a,minimum height=2.5*\a,
                      outer sep=0pt},
  dot/.style={fill,shape=circle,inner sep=1pt,outer sep=0pt},
  node distance=\a and \a
]
  \draw[style=help lines,step=0.25cm] (-1.5,-2) grid (4.5,2);

  \node[large block] (G1) at (0,0) {$G_1$};
  \node[dot,fill=red] at (G1) {};
  \node[dot,above right=-0.5*\a and \a of G1,"above:$r_1$"] (r1) {};
  \draw[-latex] ([yshift=0.75*\a]G1.east) -- (r1);

  \node[large block] (G2) at (3,0) {$G_2$};
  \node[dot,fill=green] at (G2.center) {};
  \node[dot,above right=-0.5*\a and \a of G2.center,"above:$r_2$"] (r2) {};
  \draw[-latex] ([yshift=0.75*\a]G2.east) -- (r2);
\end{tikzpicture}
\end{document}

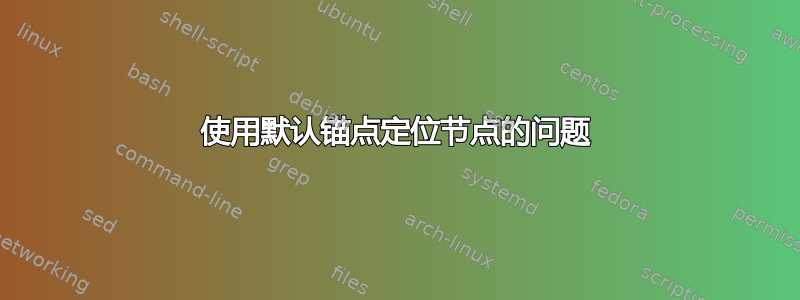
尽管矩形G1和G2似乎位于同一个 y 轴,但这取决于我选择G1还是G1.center点r1最终位于完全不同的 y 位置?
另外,黑点稍微移动了一下,并没有出现在网格上?
答案1
您正在使用positioning库,这意味着节点距离是在节点边界之间测量的,而不是它们的中心点。当节点的位置为 时above right,G1距离是从 的north east锚点G1测量的。因此,您看到的 G1 是预期的输出。如果您希望从节点的中心点测量距离,则需要选项on grid,如手册第 17.5.3 节所述。
由于某种原因,on grid没有达到预期的效果r2,我不知道为什么。但是你可以anchor=center在后面添加来实现相同的效果above right。

\documentclass[tikz]{standalone}
\usetikzlibrary{positioning}
\usetikzlibrary{quotes}
\RequirePackage{luatex85}

\begin{document}
\newcommand\Unit{1cm} % \a is already defined
\begin{tikzpicture}[
  large block/.style={draw,thick,
                      on grid, % added
                      rectangle,minimum width=\Unit,minimum height=2.5*\Unit,
                      outer sep=0pt},
  dot/.style={fill,shape=circle,
              on grid, % added
              inner sep=1pt,outer sep=0pt},
  node distance=\Unit and \Unit
]
  \draw[style=help lines,step=0.25cm] (-1.5,-2) grid (4.5,2);

  \node[large block] (G1) at (0,0) {$G_1$};
  \node[dot,fill=red] at (G1) {};
  \node[dot,above right=-0.5*\Unit and \Unit of G1,"above:$r_1$"] (r1) {};
  \draw[-latex] ([yshift=0.75*\Unit]G1.east) -- (r1);

  \node[large block] (G2) at (3,0) {$G_2$};
  \node[dot,fill=green] at (G2.center) {};
  \node[dot,above right=-0.5*\Unit and \Unit of G2.center,
        anchor=center,
        "above:$r_2$"] (r2) {};
  \draw[-latex] ([yshift=0.75*\Unit]G2.east) -- (r2);
\end{tikzpicture}
\end{document}