

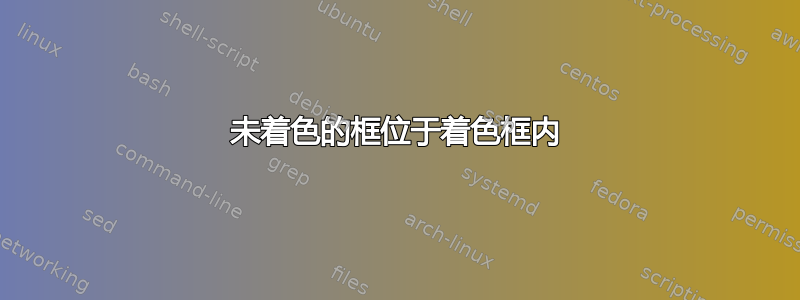
到目前为止我所拥有的是这样的:
您可以使用以下脚本生成它:
\documentclass{article}
\usepackage[utf8]{inputenc}


\usepackage{tikz}
\usetikzlibrary{calc}
\usepackage{amsmath}
\usepackage{amssymb}
\usepackage{mdframed}

\begin{document}


\begin{figure}[h]
    \centering
    \begin{mdframed}
    \[
    \begin{tikzpicture}[scale=1]
        \foreach \i /\x/\y in {
            1/1.2/0,
            2/0.6/1.0392304845413,
            3/-0.6/1.0392304845413,
            4/-1.2/0,
            5/-0.6/-1.0392304845413,
            6/0.6/-1.0392304845413,
            7/0/1.3,
            8/0/-1.3,
            9/1.2928932188135/1.2928932188135,
            10/1.2928932188135/-1.2928932188135,
            11/-1.2928932188135/1.2928932188135,
            12/-1.2928932188135/-1.2928932188135
        }{
            \node [coordinate] (n\i) at (\x,\y) {\i};
        }

        \foreach \i in {1,...,12} {
            \fill [orange,opacity=0.3] (n\i) circle (1);
            \fill (n\i) circle (1pt);
            %\draw [red] (n\i) circle (0.70710678118655);
            %\draw [green] (n\i) circle (2.2360679774998);
        }
    \filldraw[black, fill opacity=0.2] ($(-2,2)$) rectangle ($(2,-2)$);
    \filldraw[black, fill opacity=0] ($(-0.25,0.25)$) rectangle ($(0.25,-0.25)$);
    \draw (-2,2) node[below right] {$\mathcal{D}$};
    \end{tikzpicture}
    \begin{tikzpicture}[scale=1]
        \foreach \i /\x/\y in {
            1/1.2/0,
            2/0.6/1.0392304845413,
            3/-0.6/1.0392304845413,
            4/-1.2/0,
            5/-0.6/-1.0392304845413,
            6/0.6/-1.0392304845413,
            7/0/1.3,
            8/0/-1.3,
            9/1.2928932188135/1.2928932188135,
            10/1.2928932188135/-1.2928932188135,
            11/-1.2928932188135/1.2928932188135,
            12/-1.2928932188135/-1.2928932188135
        }{
            \node [coordinate] (n\i) at (\x,\y) {\i};
        }

        \foreach \i in {1,...,12} {
            \fill [orange,opacity=0.3] (n\i) circle (1);
            \fill (n\i) circle (1pt);
            %\draw [red] (n\i) circle (0.70710678118655);
            %\draw [green] (n\i) circle (2.2360679774998);
        }
    \filldraw[black, fill opacity=0.2] ($(-2,2)$) rectangle ($(2,-2)$);
    \draw (-2,2) node[below right] {$\mathcal{D}$};
    \end{tikzpicture}
    \]
    \end{mdframed}
    \caption{An example of a Sensor Network in $\mathbb{R}^2$}
    \label{fig:network}
\end{figure}

\end{document}
我想要实现但尚未完成的是(在左侧)从较小框的内部去除较大框的填充,以便仅对两个正方形的对称差异进行阴影处理。
对我有益的功能(如果存在的话)是允许负不透明度;例如,如果我可以使用脚本\filldraw[black, fill opacity=-0.2] (-2,2) rectangle (2,-2);从正方形内部移除 0.2 点不透明度,那将非常有帮助。不幸的是,我需要一个解决方法,所以有人能给我一些建议吗?我试图避免绘制四个单独的阴影区域。
答案1
我想详细阐述一下我的评论,因为我觉得我没有说明所有内容,除非举一些例子。Tikz 可以使用两种不同的规则来确定哪些区域是里面路径。默认方法是nonzero rule。此规则从区域到无穷远绘制一条任意虚拟线,并计算与路径的交叉次数。路径顺时针穿过虚拟线的次数计为正数,逆时针穿过虚拟线的次数计为负数。如果这些交叉次数的总和不为零,则该区域已填充。第二种方法,更even odd rule直观一些。此方法也从区域跟踪一条虚拟线,并仅计算交叉次数。如果总和为零,则该区域已填充。
我已将这两个选项应用到您的绘图中,并添加了一个装饰,以便您可以轻松地看到矩形是顺时针绘制的还是逆时针绘制的。请注意,对于两个任意坐标(a)和(b),该(a) rectangle (b)命令将绘制一条路径(a) -- (a|-b) -- (b) -- (b|-a) -- cycle,其中(a|-b)表示从 开始的垂直线(a)和从 开始的水平线(b)相交的点。因此,根据(a)和(b)相对于彼此的位置,矩形是顺时针绘制的还是逆时针绘制的。
代码(我也改变了你的计数器\foreach并调整了一些其他的东西):
\documentclass{article}
\usepackage[utf8]{inputenc}

\usepackage{tikz}
\usetikzlibrary{decorations.markings}
\usepackage{amsmath}
\usepackage{amssymb}
\usepackage{mdframed}

\begin{document}


\begin{figure}[h]
    \begin{mdframed}
        \centering
        \texttt{nonzero rule}:

        \begin{tikzpicture}[scale=1]
            \foreach[count = \i] \x/\y in {
                1.2/0,
                0.6/1.0392304845413,
                -0.6/1.0392304845413,
                -1.2/0,
                -0.6/-1.0392304845413,
                0.6/-1.0392304845413,
                0/1.3,
                0/-1.3,
                1.2928932188135/1.2928932188135,
                1.2928932188135/-1.2928932188135,
                -1.2928932188135/1.2928932188135,
                -1.2928932188135/-1.2928932188135
            }{
                \coordinate (n\i) at (\x,\y);
            }

            \foreach \i in {1,...,12} {
                \fill [orange,opacity=0.3] (n\i) circle (1);
                \fill (n\i) circle (1pt);
            }
        \filldraw[black, fill opacity=0.2, decoration={markings,mark=between positions 0 and 1 step 2.5mm with \arrow{>}},postaction={decorate}]
            (-2,2) rectangle (2,-2)
            (-0.25,-0.25) rectangle (0.25,0.25);
        \draw (-2,2) node[below right] {$\mathcal{D}$};
        \end{tikzpicture}
        \begin{tikzpicture}[scale=1]
            \foreach[count = \i] \x/\y in {
                1.2/0,
                0.6/1.0392304845413,
                -0.6/1.0392304845413,
                -1.2/0,
                -0.6/-1.0392304845413,
                0.6/-1.0392304845413,
                0/1.3,
                0/-1.3,
                1.2928932188135/1.2928932188135,
                1.2928932188135/-1.2928932188135,
                -1.2928932188135/1.2928932188135,
                -1.2928932188135/-1.2928932188135
            }{
                \coordinate (n\i) at (\x,\y);
            }

            \foreach \i in {1,...,12} {
                \fill [orange,opacity=0.3] (n\i) circle (1);
                \fill (n\i) circle (1pt);
            }
            \filldraw[black, fill opacity=0.2, decoration={markings,mark=between positions 0 and 1 step 2.5mm with \arrow{>}},postaction={decorate}]
                (-2,2) rectangle (2,-2)
                (-0.25,0.25) rectangle (0.25,-0.25);
        \draw (-2,2) node[below right] {$\mathcal{D}$};
        \end{tikzpicture}

        \texttt{even odd rule}:

        \begin{tikzpicture}[scale=1]
            \foreach[count = \i] \x/\y in {
                1.2/0,
                0.6/1.0392304845413,
                -0.6/1.0392304845413,
                -1.2/0,
                -0.6/-1.0392304845413,
                0.6/-1.0392304845413,
                0/1.3,
                0/-1.3,
                1.2928932188135/1.2928932188135,
                1.2928932188135/-1.2928932188135,
                -1.2928932188135/1.2928932188135,
                -1.2928932188135/-1.2928932188135
            }{
                \coordinate (n\i) at (\x,\y);
            }

            \foreach \i in {1,...,12} {
                \fill [orange,opacity=0.3] (n\i) circle (1);
                \fill (n\i) circle (1pt);
            }
            \filldraw[even odd rule, black, fill opacity=0.2, decoration={markings,mark=between positions 0 and 1 step 2.5mm with \arrow{>}},postaction={decorate}]
                (-2,2) rectangle (2,-2)
                (-0.25,-0.25) rectangle (0.25,0.25);
            \draw (-2,2) node[below right] {$\mathcal{D}$};
        \end{tikzpicture}
        \begin{tikzpicture}[scale=1]
            \foreach[count = \i] \x/\y in {
                1.2/0,
                0.6/1.0392304845413,
                -0.6/1.0392304845413,
                -1.2/0,
                -0.6/-1.0392304845413,
                0.6/-1.0392304845413,
                0/1.3,
                0/-1.3,
                1.2928932188135/1.2928932188135,
                1.2928932188135/-1.2928932188135,
                -1.2928932188135/1.2928932188135,
                -1.2928932188135/-1.2928932188135
            }{
                \coordinate (n\i) at (\x,\y);
            }

            \foreach \i in {1,...,12} {
                \fill [orange,opacity=0.3] (n\i) circle (1);
                \fill (n\i) circle (1pt);
            }
            \filldraw[even odd rule, black, fill opacity=0.2, decoration={markings,mark=between positions 0 and 1 step 2.5mm with \arrow{>}},postaction={decorate}]
                (-2,2) rectangle (2,-2)
                (-0.25,0.25) rectangle (0.25,-0.25);
            \draw (-2,2) node[below right] {$\mathcal{D}$};
        \end{tikzpicture}
    \end{mdframed}
    \caption{An example of a Sensor Network in $\mathbb{R}^2$}
    \label{fig:network}
\end{figure}

\end{document}
结果是:

您可以看到,使用even odd rule可以更轻松地从周围路径中减去一条路径,而 则以nonzero rule直观性为代价提供了更多的灵活性。
这一切在Tikz/PGF 手册(版本 3.0.1a),第 15.5.2 节,第 172 页。
答案2
我写完这个问题后才意识到我可以先画出方框,然后再画圆圈,然后用纯白色填充里面的方框:
\documentclass{article}
\usepackage[utf8]{inputenc}


\usepackage{tikz}
\usetikzlibrary{calc}
\usepackage{amsmath}
\usepackage{amssymb}
\usepackage{mdframed}

\begin{document}


\begin{figure}[h]
    \centering
    \begin{mdframed}
    \[
    \begin{tikzpicture}[scale=1]
        \foreach \i /\x/\y in {
            1/1.2/0,
            2/0.6/1.0392304845413,
            3/-0.6/1.0392304845413,
            4/-1.2/0,
            5/-0.6/-1.0392304845413,
            6/0.6/-1.0392304845413,
            7/0/1.3,
            8/0/-1.3,
            9/1.2928932188135/1.2928932188135,
            10/1.2928932188135/-1.2928932188135,
            11/-1.2928932188135/1.2928932188135,
            12/-1.2928932188135/-1.2928932188135
        }{
            \node [coordinate] (n\i) at (\x,\y) {\i};
        }

        \foreach \i in {1,...,12} {
            \fill [orange,opacity=0.3] (n\i) circle (1);
            \fill (n\i) circle (1pt);
            %\draw [red] (n\i) circle (0.70710678118655);
            %\draw [green] (n\i) circle (2.2360679774998);
        }
    \filldraw[black, fill opacity=0.2] ($(-2,2)$) rectangle ($(2,-2)$);
    \draw (-2,2) node[below right] {$\mathcal{D}_1$};
    \end{tikzpicture}
    \begin{tikzpicture}[scale=1]
        \foreach \i /\x/\y in {
            1/1.2/0,
            2/0.6/1.0392304845413,
            3/-0.6/1.0392304845413,
            4/-1.2/0,
            5/-0.6/-1.0392304845413,
            6/0.6/-1.0392304845413,
            7/0/1.3,
            8/0/-1.3,
            9/1.2928932188135/1.2928932188135,
            10/1.2928932188135/-1.2928932188135,
            11/-1.2928932188135/1.2928932188135,
            12/-1.2928932188135/-1.2928932188135
        }{
            \node [coordinate] (n\i) at (\x,\y) {\i};
        }
        \filldraw[black, fill opacity=0.2] ($(-2,2)$) rectangle ($(2,-2)$);
        \filldraw[black, fill=white] ($(-0.25,0.25)$) rectangle ($(0.25,-0.25)$);
        \foreach \i in {1,...,12} {
            \fill [orange,opacity=0.3] (n\i) circle (1);
            \fill (n\i) circle (1pt);
            %\draw [red] (n\i) circle (0.70710678118655);
            %\draw [green] (n\i) circle (2.2360679774998);
        }
    \draw (-2,2) node[below right] {$\mathcal{D}_0$};
    \end{tikzpicture}
    \]
    \end{mdframed}
    \caption{An example of a Sensor Network in two different domains $\mathcal{D}_0,\mathcal{D}_1\subset\mathbb{R}^2$}
    \label{fig:network}
\end{figure}

\end{document}
得到以下结果: