

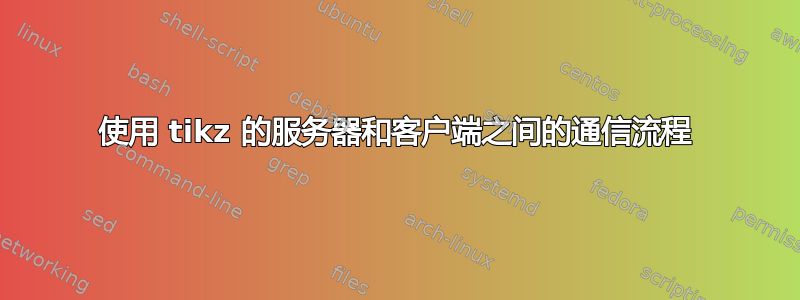
我将使用 Tikz 表示客户端和服务器之间的通信流。图像中报告了通信流。

基于此,我开始在工作中使用 Tikz 设计这个流程。目前的代码是:
  \begin{tikzpicture}[node distance=2cm,auto,>=stealth']
\node[] (server) {Server};
\node[left = of server] (client) {Client};
\node[below of=server, node distance=5cm] (server_ground) {};
\node[below of=client, node distance=5cm] (client_ground) {};
%
\draw (client) -- (client_ground);
\draw (server) -- (server_ground);
\draw[->] ($(client)!0.25!(client_ground)$) -- node[above,scale=1,midway]{m_1} ($(server)!0.25!(server_ground)$);
\draw[<-] ($(client)!0.35!(client_ground)$) -- node[above,scale=1,midway]{Response m_1} ($(server)!0.35!(server_ground)$);
\draw[->] ($(client)!0.45!(client_ground)$) -- node[above,scale=1,midway]{m2} ($(server)!0.45!(server_ground)$);
\end{tikzpicture}
但我无法设计 m2 和 m3 下方的点以及右侧与时间相关的线。
你能帮我吗?
此致,
答案1
欢迎!我不会进行所有这些坐标计算,而是设置一个局部坐标系,其中(0,0)是坐标(client_ground),(1,1)是指向的箭头的尖端server。除此之外,我会使用positioning和arrows.meta。
\documentclass[tikz,border=3mm]{standalone}
\definecolor{myblue}{RGB}{85,114,193}
\tikzset{Dotted/.style={% https://tex.stackexchange.com/a/52856/194703
    line width=1pt,
    dash pattern=on 0.01\pgflinewidth off #1\pgflinewidth,line cap=round,
    shorten >=0.3em,shorten <=0.3em},
    Dotted/.default=5}
\usetikzlibrary{arrows.meta,calc,positioning}
\begin{document}
\begin{tikzpicture}[auto,>=Triangle,font=\sffamily]
\node (server) {Server};
\node[base left=4cm  of server] (client) {Client};
\coordinate[below=6cm of server] (server_ground);
\coordinate[below=6cm of client] (client_ground);
%
\draw[line width=2pt,myblue] (client) -- (client_ground)
 (server) -- (server_ground);
\begin{scope}[line width=3pt,draw=myblue,shift={(client_ground)},
    nodes={above},declare function={t1=0.85;r1=0.6;t2=0.45;t3=0.1;},
    x={($(server_ground)-(client_ground)$)},y={($(client.south)-(client_ground)$)}]
 \draw[->] (0,t1) -- node{$m_1$} (1,t1);
 \draw[->] (1,r1) -- node{response $m_1$} (0,r1);
 \draw[->] (0,t2) -- node(m2){$m_2$}  (1,t2);
 \draw[->] (0,t3) -- node(m3) {$m_3$}  (1,t3);
 \draw[-,Dotted=8,line width=4pt, shorten <=5pt] (m2) -- (m3);
 \draw[semithick,<->] (1.1,t3) -- (1.1,t2) node[midway,right]{Time};
\end{scope}
\end{tikzpicture}
\end{document}
