

假设我想遮蔽以下区域:
$\{ (x, y) | 1-x y>0 \}$
只要我指定x和y边界,是否有可以使用的工具来实现该结果?这比绘制函数并决定要遮蔽哪些区域更适合我。
答案1
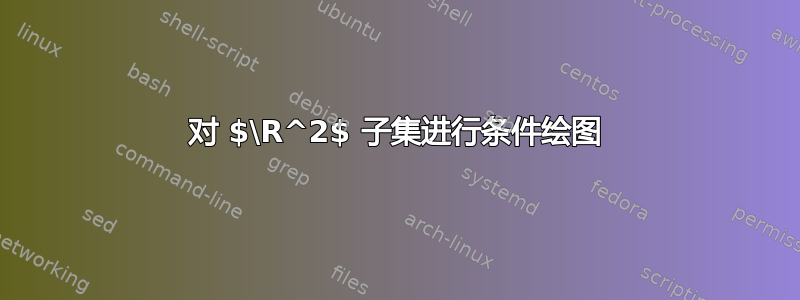
您可以绘制隐式图。以下是两个示例,它们与显式图进行了比较。我将样本数量保持在较低水平,以表明对于相同数量的样本,隐式图通常不如通过“绘制函数并决定要着色哪一侧”获得的图那么引人注目。
\documentclass[tikz,border=3mm]{standalone}
\usepackage{pgfplots}
\pgfplotsset{compat=1.17}
\begin{document}
\begin{tikzpicture}
 \pgfplotsset{domain=0:5,ymax=5,xmax=5}
 \begin{scope}[local bounding box=implicit]
  \begin{axis}[view={0}{90},
      x filter/.expression={1-x*y>0 ? x :nan}]
      \addplot3 [surf,shader=flat] {1};
  \end{axis}
  \begin{axis}[yshift=-6.5cm,view={0}{90},
    colormap={bluewhite}{color=(white) color=(blue)}]
   \addplot3 [contour filled={levels={0}}] {1-x*y};
  \end{axis}
 \end{scope}
 \begin{scope}[local bounding box=explicit]
  \begin{axis}[xshift=8cm]
   \addplot[blue,fill=blue] {1/x} |- (0,0) |- cycle;
  \end{axis}
  \begin{axis}[xshift=8cm,yshift=-6.5cm]
   \addplot[blue,fill=blue,smooth] {1/x} |- (0,0) |- cycle;
  \end{axis}
 \end{scope}
 \path (implicit.north) node[above] {implicit plots}
 (explicit.north) node[above] {explicit plots};
\end{tikzpicture}
\end{document}
