

我的问题与这个主要区别在于我需要创建一个包含多个合并在一起的列的空数组,如下图所示

我如何合并列并添加下支撑?
编辑:我认为我以错误的方式表达了我的请求
我的想法是创建一个数组,如图所示。
为此,我阅读了论坛中的一些先前请求,并从中汲取灵感,以便完成我想要做的事情。
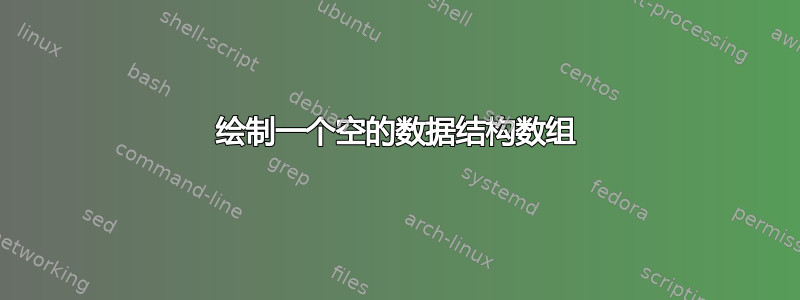
我链接的示例得到了如下所示的输出:

与我的请求的主要区别在于,在我的示例中,有多个单元格合并在一起。
如下所示:

第一张照片的代码是这样的:
\documentclass[tikz,border=2mm]{standalone}
\usetikzlibrary{matrix,backgrounds}

\begin{document}
\begin{tikzpicture}[font=\ttfamily,
array/.style={matrix of nodes,nodes={draw, minimum size=7mm, fill=green!30},column sep=-\pgflinewidth, row sep=0.5mm, nodes in empty cells,
row 1/.style={nodes={draw=none, fill=none, minimum size=5mm}},
row 1 column 1/.style={nodes={draw}}}]

\matrix[array] (array) {
0 & 1 & 2 & 3 & 4 & 5 & 6 & 7 & 8 & 9\\
  &   &   &   &   &   &   &   &   &  \\};
\node[draw, fill=gray, minimum size=4mm] at (array-2-9) (box) {};

\begin{scope}[on background layer]
\fill[green!10] (array-1-1.north west) rectangle (array-1-10.south east);
\end{scope}

\draw[<->]([yshift=-3mm]array-2-1.south west) -- node[below] {Array length is 10} ([yshift=-3mm]array-2-10.south east);

\draw (array-1-1.north)--++(90:3mm) node [above] (first) {First index};
\draw (array-1-10.east)--++(0:3mm) node [right]{Indices};
\node [align=center, anchor=south] at (array-2-9.north west|-first.south) (8) {Element\\ (at index 8)};
\draw (8)--(box);
%
\end{tikzpicture}
\end{document}
答案1
您可以定义在行或单个单元格周围添加框架的样式。
\documentclass[tikz,border=2mm]{standalone}
\usetikzlibrary{matrix,backgrounds}
\usetikzlibrary{decorations.pathreplacing,calligraphy}
\tikzset{matrix row frame/.style={execute at end matrix={%
\path[matrix frame] (\tikzmatrixname-#1-1.south west)
rectangle
(\tikzmatrixname-#1-\the\pgfmatrixcurrentcolumn.north east);}},
matrix cell frame/.style args={#1-#2}{execute at end matrix={%
\path[matrix frame] (\tikzmatrixname-#1-#2.south west)
rectangle (\tikzmatrixname-#1-#2.north east);}},
matrix frame/.style={draw}
}
\begin{document}
\begin{tikzpicture}[font=\ttfamily,
array/.style={matrix of nodes,
column sep=-\pgflinewidth, row sep=0.5mm, nodes in empty cells,
row 1/.style={nodes={draw=none, minimum size=5mm}},
row 2/.style={nodes={fill=green!30, minimum size=7mm}},
row 1 column 1/.style={nodes={draw}}}]

\matrix[array,matrix row frame=2,matrix cell frame=2-6] (array) {
0 & 1 & 2 & 3 & 4 & 5 & 6 & 7 & 8 & 9\\
  &   &   &   &   &   &   &   &   &  \\};
\node[draw, fill=gray, minimum size=4mm] at (array-2-9) (box) {};
\draw[decorate,decoration={calligraphic brace,raise=0.2ex},thick]
  (array.south-|array-2-5.east) --  node[midway,below=1ex,font=\sffamily]{ORDINATA}
  (array.south-|array-2-1.west);

\begin{scope}[on background layer]
\fill[green!10] (array-1-1.north west) rectangle (array-1-10.south east);
\end{scope}

\draw[<->]([yshift=-13mm]array-2-1.south west) -- node[below] {Array length is
10} ([yshift=-13mm]array-2-10.south east);

\draw (array-1-1.north)--++(90:3mm) node [above] (first) {First index};
\draw (array-1-10.east)--++(0:3mm) node [right]{Indices};
\node [align=center, anchor=south] at (array-2-9.north west|-first.south) (8) {Element\\ (at index 8)};
\draw (8)--(box);
%
\end{tikzpicture}
\end{document}
