

我想用 LaTeX 绘制这个图形,但我遇到了一些有关电子路径的问题,我怎样才能找到与我的粒子路径相似的函数,这是我的方法,我希望有人能帮助我如何找到路径的代码
\begin{tikzpicture}[scale=2]
\draw[thick] (0,0)--(4,0) node[right] {$A$};
\draw[thick] (0,-2)--(4,-2) node[right] {$B$};
\draw[smooth, ->] (0,-1)--(3.5, -1) node[below] {$x$};
\draw[smooth, ->] (0,-1)--(0,-0.1) node[left] {$y$};
\node[below] at (0,-1) {$O$};
\node[] at (0,-1) {$\bullet$};
\draw[->, thick] (0,-1)--(0.5, -1) node[below, midway] {$\vec{i}$};
\draw[->, thick] (0,-1)--(0, -0.5)node[left, midway] {$\vec{j}$};
\draw[->, thick] (0,-1)--(0.3, -1) node[above, midway] {$\vec{v}_0$};
\draw[smooth, <->] (-0.2, 0)--(-0.2, -2) node[midway, left] {$d$};
\draw[smooth, <-] (3.9, -0.1)--(3.9, -1.9) node[midway, left] {$U$};
\draw[smooth, ->] (2,-1.1)--(2,-1.9) node[midway, left] {$\vec{E}$};
\end{tikzpicture}
这是我的结果:

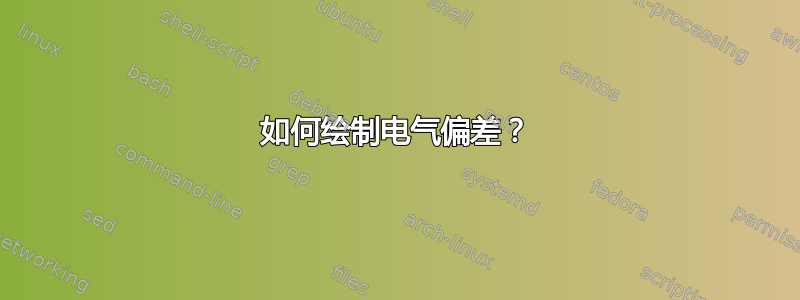
这就是我想要的:

答案1
这样怎么样?我使用了parabola来自的路径tikz作为轨迹,但另一种方法是使用plot函数(因为我们知道足够多的点)。
如果需要,您可以修改尺寸,几乎所有尺寸都是参数化的。
这是我的例子:
\documentclass[border=2mm]{standalone}
\usepackage    {tikz}
\usetikzlibrary{babel} % sometimes tikz and babel don't get along
\usetikzlibrary{calc}

\begin{document}
\begin{tikzpicture}[line cap=round,line join=round]
% parameters
\def\l{4}
\def\d{2.2}
\def\x{2}
\def\D{5}
\def\sy{0.65}
% calculated dimensions
\pgfmathsetmacro\px{\l-\x+\D}             % point P, x
\pgfmathsetmacro\py{\sy+2*\sy*(\D-\x)/\l} % point P, y
\pgfmathsetmacro\a {atan(2*\sy/\l)}       % angle alpha
% coordinates
\coordinate (O)  at (0,0);
\coordinate (O') at (\px,0);
\coordinate (X)  at (\x,0);
\coordinate (S)  at (\l,\sy);
\coordinate (P)  at (\px,\py);
% axes
\draw[latex-latex,green!50!black] (0,\d) node [above right] {$y$} |- (\l-\x+\D+1,0) node [above right] {$x$};
% capacitor
\foreach\i/\j in {1/A,-1/B}
  \draw[thick,gray] (0,\i*0.5*\d) --++ (\l,0) node [above] {$\j$};
% screen
\draw[thick,green!50!black] (\px,\py+1) -- (\px,-\py-1);
% cotes
\draw[dashed] (-1,0.5*\d)  -- (0,0.5*\d);
\draw[dashed] (-1,-0.5*\d) -| (0,-0.5*\d-1);
\draw[dashed] (\l,-0.5*\d) -- (\l,-0.5*\d-1);
\draw[dashed] (\x,-0.6) -- (X) --  (S) --++ (1,0);
\draw[dashed] (P) --++ (0.5,0);
\draw[<->] (0,-0.5*\d-1) --++ (\l,0)   node [midway,above] {$\ell$};
\draw[<->] (0,-0.6) --++ (\x,0)        node [midway,above] {$x$};
\draw[<->] (\x,-0.6) -- (\px,-0.6)     node [midway,above] {$D$};
\draw[<->] (-1,0.5*\d) --++ (0,-\d)    node [midway,left]  {$d$};
\draw[<->] (\px+.5,\py) -- (\px+0.5,0) node [midway,right] {$D_e$};
% trajectory and angles
\foreach\i in {X,S}
  \draw ($(\i)+(\a:0.5)$) arc (\a:0:0.5) node [below] {$\alpha$};
\draw[thick,red] (O) parabola (S) -- (P);
% vectors
\draw[thick,blue,latex-latex] (0,0.7) node [left] {$\vec F$} |- (0.8,0) node [above] {$\vec v_0$};
\draw[thick,blue,-latex] (S) -- ($(S)!0.8cm!(P)$) node[above] {$\vec V_S$};
\draw[thick,blue,-latex] (0.7*\x,0.8) --++ (0,-0.6) node [midway,right] {$\vec E$};
% electrons
\fill[shading=ball,ball color=red] (O) circle (2pt) node [below] {$O$};
\fill[shading=ball,ball color=red] (S) circle (2pt) node [below] {$S$};
\fill[shading=ball,ball color=red] (P) circle (2pt) node [above right] {$P$};
\end{tikzpicture}
\end{document}
