

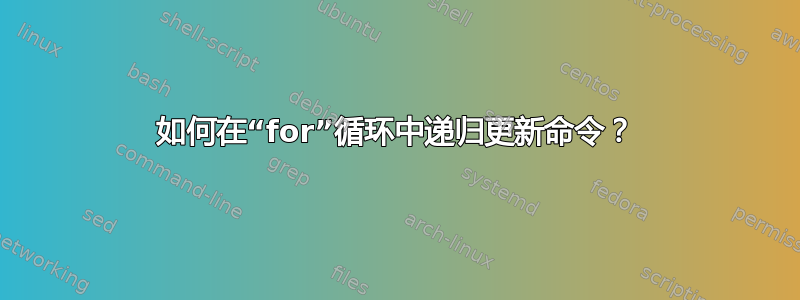
我正在尝试使用 绘制函数和,其参数由用户指定pgfplots。
\documentclass{article}
\usepackage{pgfplots}
\newcommand{\myfun}[2]{(cos(#1*\x) + sin(#2*\x))}
\begin{document}
    \begin{tikzpicture}
        \begin{axis}[domain=0:100]
            \addplot[red,samples=300]{\myfun{10}{20}+\myfun{5}{10}};
        \end{axis}
    \end{tikzpicture}
\end{document}
这可行,但我希望用户输入以下形式的命令\plotwave{{10,20},{5,10}}(这样我就可以使用相同的参数来绘制多个参数函数,,,\myfuna等等\myfunb)。所以,我尝试了
\documentclass{article}
\usepackage{pgffor,pgfplots}

\newcommand{\myfun}[2]{(cos(#1*\x) + sin(#2*\x))}
\newcommand{\plotwave}[1]{
    \newcounter{ind}
    \newcommand{\aaa}{0}
    \newcommand{\bbb}{0}
    \newcommand{\plotcommand}{0}
    \newcommand{\oldplotcommand}{0}
    \foreach \z in {#1} {
        \setcounter{ind}{0}
        \foreach \y in \z {
            \stepcounter{ind}
            \ifnum\the\value{ind}=1
                \global\let\aaa\y
            \else
                \global\let\bbb\y
            \fi
        }
        \let\oldplotcommand\plotcommand
        \gdef\plotcommand{\oldplotcommand + \myfun{\aaa}{\bbb}}
    }
    \addplot[red,samples=300]{\plotcommand};
}
\begin{document}
    \begin{tikzpicture}
        \begin{axis}[domain=0:100]
            \plotwave{{100,200},{10,20}};
        \end{axis}
    \end{tikzpicture}
\end{document}
但那不起作用。没有错误,但只绘制了第二个函数,而不是两个函数的总和。添加\global到\let命令会因崩溃TeX capacity exceeded。该\gdef\plotcommand{\oldplotcommand + \myfun{\aaa}{\bbb}}部分似乎没有按照我的预期执行。有没有办法使用pgffor和来实现我想要的效果pgfplots?
答案1
一方面,的每次迭代\foreach都在其自己的本地范围/组中进行,因此如果\let前面没有,事情就无法顺利进行\global。
另一方面,如果\let前面有\global,那么全局就会赋予执行-赋值时\oldplotcommand所具有的含义。\plotcommand\let
\plotcommand反过来又定义为调用\oldplotcommand。
因此,您最终得到一个\oldplotcommand以递归方式(但不是尾部递归(!))调用自身的命令,该命令一次又一次地调用自身,从而+ \myfun{\aaa}{\bbb}在调用之后积累了越来越多的标记流序列,\oldplotommand直到! TeX capacity exceeded发生错误。
如果你添加\show-commands
\documentclass{article}
\usepackage{pgffor,pgfplots}

\newcommand{\myfun}[2]{(cos(#1*\x) + sin(#2*\x))}
\newcommand{\plotwave}[1]{
    \newcounter{ind}
    \newcommand{\aaa}{0}
    \newcommand{\bbb}{0}
    \newcommand{\plotcommand}{0}
    \newcommand{\oldplotcommand}{0}
    \foreach \z in {#1} {
        \setcounter{ind}{0}
        \foreach \y in \z {
            \stepcounter{ind}
            \ifnum\the\value{ind}=1
                \global\let\aaa\y
            \else
                \global\let\bbb\y
            \fi
        }
        \global\let\oldplotcommand\plotcommand
        \gdef\plotcommand{\oldplotcommand + \myfun{\aaa}{\bbb}}
    }
    \show\plotcommand
    \show\oldplotcommand
    \addplot[red,samples=300]{\plotcommand};
}
\begin{document}
    \begin{tikzpicture}
        \begin{axis}[domain=0:100]
            \plotwave{{100,200},{10,20}};
        \end{axis}
    \end{tikzpicture}
\end{document}
,然后控制台上的消息显示:
> \plotcommand=macro:
->\oldplotcommand + \myfun {\aaa }{\bbb }.
\plotwave ...{\aaa }{\bbb }} } \show \plotcommand
                                                  \show \oldplotcommand \add...
l.31             \plotwave{{100,200},{10,20}}
                                             ;
?
> \oldplotcommand=macro:
->\oldplotcommand + \myfun {\aaa }{\bbb }.
\plotwave ...w \plotcommand \show \oldplotcommand
如您所见:被定义为在 token 流前面\oldplotcommand添加对自身的调用和 token 序列。因此,每次迭代时,都会在来自该迭代的对的调用后面累积另一个序列。 一旦没有足够的内存来在对的调用后面累积另一个序列,您就会得到-error。+ \myfun{\aaa}{\bbb}\oldplotcommand+ \myfun{\aaa}{\bbb}\oldplotcommand+ \myfun{\aaa}{\bbb}\oldplotcommand! TeX capacity exceeded
为了防止这种自调用递归,在 的定义文本中\plotcommand,您的代码定义为
\gdef\plotcommand{\oldplotcommand + \myfun{\aaa}{\bbb}}
,其中的标记\oldplotcommand和\aaa和\bbb需要进行扩展。
您可以使用巨大的\expandafter-orgy 来实现这一点,即三个\expandafter-chains,其中一个\expandafter-chain 用于需要扩展的令牌之一:
% Chain 1   |Chain 2    |Chain 3
\expandafter\expandafter
\expandafter            \expandafter
\expandafter\expandafter
\expandafter                        \gdef
\expandafter\expandafter
\expandafter            \expandafter
\expandafter\expandafter
\expandafter                        \plotcommand
\expandafter\expandafter
\expandafter            \expandafter
\expandafter\expandafter
\expandafter                        {%
\expandafter\expandafter
\expandafter            \oldplotcommand
\expandafter\expandafter
\expandafter            +%
\expandafter\expandafter
\expandafter            \myfun
\expandafter\expandafter
\expandafter            {%
\expandafter\aaa
\expandafter}%
\expandafter{%
\bbb}}
如果\unexpandede-TeX-extensions 可用,您可以执行以下操作:
\xdef\plotcommand{%
  \unexpanded\expandafter{\oldplotcommand + \myfun}%
  {\unexpanded\expandafter{\aaa}}%
  {\unexpanded\expandafter{\bbb}}%
}%
实际上你不需要\oldplotcommand,你可以\plotcommand扩展:
\xdef\plotcommand{%
  \unexpanded\expandafter{\plotcommand + \myfun}%
  {\unexpanded\expandafter{\aaa}}%
  {\unexpanded\expandafter{\bbb}}%
}%
经过这个小小的修改,你的代码就可以运行了:
\documentclass{article}
\usepackage{pgffor,pgfplots}

% allocate scratch-count-register and define scratch-macros only once instead
% of doing this whenever carrying out `\plotwave` and thus repeatedly:
\newcounter{ind}
\newcommand{\aaa}{0}
\newcommand{\bbb}{0}
\newcommand{\plotcommand}{0}

\newcommand{\myfun}[2]{(cos(#1*\x) + sin(#2*\x))}

\newcommand{\plotwave}[1]{%%
    \renewcommand{\plotcommand}{0}%%
    \renewcommand{\aaa}{0}%%
    \renewcommand{\bbb}{0}%%
    \foreach \z in {#1} {%%
        \setcounter{ind}{0}%%
        \foreach \y in \z {%%
            \stepcounter{ind}%%
            \ifnum\the\value{ind}=1 %%
                \global\let\aaa\y
            \else
                \global\let\bbb\y
            \fi
        }%%
        \xdef\plotcommand{%%
          \unexpanded\expandafter{\plotcommand + \myfun}%%
          {\unexpanded\expandafter{\aaa}}%%
          {\unexpanded\expandafter{\bbb}}%%
        }%%
    }%%
    %\show\plotcommand
    \addplot[red,samples=300]{\plotcommand};%%
}
\begin{document}
    \begin{tikzpicture}
        \begin{axis}[domain=0:100]
            \plotwave{{100,200},{10,20}};
        \end{axis}
    \end{tikzpicture}
\end{document}

如果你不想使用额外的包,你可以,例如,在一个单独的临时宏中收集东西,而不是使用四个临时宏\aaa、\bbb和:\plotcommand\oldplotcommand
\documentclass{article}
\usepackage{pgffor,pgfplots}

\newcommand\scratchmacro{}%

\newcommand{\myfun}[2]{(cos(#1*\x) + sin(#2*\x))}%

\newcommand{\plotwave}[3]{%%%
    \gdef\scratchmacro{}%
    \foreach \z in {#3}{%
        \ifcat$\detokenize\expandafter{\scratchmacro}$%<-check if \scratchmacro is defined empty/first \foreach iteration
          \xdef\scratchmacro{\unexpanded\expandafter{\scratchmacro#2}}%
        \else
          \xdef\scratchmacro{\unexpanded\expandafter{\scratchmacro#1#2}}%
        \fi
        \foreach \y in \z {%
            \xdef\scratchmacro{\unexpanded\expandafter{\scratchmacro}{\y}}%
            %If you want only toplevel-expansion of \y instead of full expansion of \y :
            %\xdef\scratchmacro{\unexpanded\expandafter{\scratchmacro}{\unexpanded\expandafter{\y}}}%
        }%
    }%
    %\show\scratchmacro
    \addplot[red,samples=300]{\scratchmacro};
}
\begin{document}
    \begin{tikzpicture}
        \begin{axis}[domain=0:100]
            \plotwave{+}{\myfun}{{100,200},{10,20}};
        \end{axis}
    \end{tikzpicture}
\end{document}
或者,您可以使用临时令牌寄存器。与上面的示例不同,下面的示例 \y将仅在顶层展开,而不是完全展开:
\documentclass{article}
\usepackage{pgffor,pgfplots}

\newtoks\scratchtoks{}%

\newcommand{\myfun}[2]{(cos(#1*\x) + sin(#2*\x))}%

\newcommand{\plotwave}[3]{%%%
    \global\scratchtoks{}%
    \foreach \z in {#3}{%
        \ifcat$\detokenize\expandafter{\the\scratchtoks}$%<-check if \scratchtoks is empty/first \foreach iteration
          \global\scratchtoks\expandafter{\the\scratchtoks#2}%
        \else
          \global\scratchtoks\expandafter{\the\scratchtoks#1#2}%
        \fi
        \foreach \y in \z {%
           \global\scratchtoks\expandafter{\the\expandafter\scratchtoks\expandafter{\y}}%
        }%
    }%
    %\showthe\scratchtoks
    \addplot[red,samples=300]{\the\scratchtoks};
}
\begin{document}
    \begin{tikzpicture}
        \begin{axis}[domain=0:100]
            \plotwave{+}{\myfun}{{100,200},{10,20}};
        \end{axis}
    \end{tikzpicture}
\end{document}
答案2
可以使用expl3: 命令
\plotwave[red,samples=300]{\myfun}{{0,5},{10,20}}
我们建造
\addplot[red,samples=300]{\myfun{0}{5}+\myfun{10}{20}}
并执行它。
第一个强制参数是具有一定数量参数的任何预定义函数,第二个强制参数是一个以逗号分隔的列表,每个列表都有所需数量的项目。
\documentclass{article}
\usepackage{pgfplots}
\pgfplotsset{compat=1.18}

\newcommand{\myfun}[2]{(cos(#1*\x) + sin(#2*\x))}

\ExplSyntaxOn
\NewDocumentCommand{\plotwave}{O{}mm}
 {% #1 = options to \addplot
  % #2 = function to use
  % #3 = list of parameters
  \rushi_plotwave:nnn { #1 } { #2 } { #3 }
 }

\seq_new:N \l__rushi_plotwave_in_seq
\seq_new:N \l__rushi_plotwave_out_seq

\cs_new_protected:Nn \rushi_plotwave:nnn
 {
  % split the list of parameters at commas
  \seq_set_from_clist:Nn \l__rushi_plotwave_in_seq { #3 }
  % clear the sequence that will get the various parts to sum
  \seq_clear:N \l__rushi_plotwave_out_seq
  % populate it
  \seq_map_inline:Nn \l__rushi_plotwave_in_seq
   {
    \seq_put_right:Nx \l__rushi_plotwave_out_seq
     {
      % we want to transform {a,b} into {a}{b}
      % so to obtain \myfun{a}{b}; #2 is the function to use
      \exp_not:N #2 \clist_map_function:nN { ##1 } \__rushi_plotwave_arg:n
     }
   }
  % draw the plot
  \addplot[#1]{\seq_use:Nn \l__rushi_plotwave_out_seq { + }}
 }

% helper command to transform {a,b} into {a}{b}
\cs_new:Nn \__rushi_plotwave_arg:n { {#1} }

\ExplSyntaxOff

\begin{document}

\begin{tikzpicture}
  \begin{axis}[domain=0:100]
    \plotwave[red,samples=300]{\myfun}{{0,5},{10,20}};
  \end{axis}
\end{tikzpicture}

\end{document}

答案3
以下是使用\epxandonce(来自etoolbox)和.list的处理程序的解决方案pgfkeys:
\documentclass{standalone}
\pagestyle{empty}
\usepackage{pgfplots}
\usepackage{etoolbox}
\newcommand{\myfun}[2]{(cos(#1*\x) + sin(#2*\x))}
\newcommand{\plotwave}[1]{
  \def\plotcommand{0}
  \pgfset{
    @plotwave/.is family,@plotwave, % my family
    addwave/.code args={##1,##2}{
      \edef\plotcommand{\expandonce\plotcommand + \noexpand\myfun{##1}{##2}}
    },
    addwave/.list={#1},
  }
  \typeout{\meaning\plotcommand} % debug !!!
  \addplot[red,samples=1000]{\plotcommand};
}
\begin{document}
    \begin{tikzpicture}
        \begin{axis}[domain=0:100]
            \plotwave{{100,200},{10,20}};
        \end{axis}
    \end{tikzpicture}
\end{document}

这里有一个类似的解决方案,\expandonce但\pgfplotsforeach时间是这样的:
\documentclass{standalone}
\pagestyle{empty}
\usepackage{pgfplots}
\usepackage{etoolbox}
\newcommand{\myfun}[2]{(cos(#1*\x) + sin(#2*\x))}
\newcommand{\plotwave}[1]{
  \def\plotcommand{0}
  \def\addwave##1,##2\endaddwave{
    \edef\plotcommand{\expandonce\plotcommand + \noexpand\myfun{##1}{##2}}
  }
  \pgfplotsforeachungrouped \couple in {{#1}}{
    \expandafter\addwave\couple\endaddwave
  }
  \typeout{\meaning\plotcommand} % # debug !!!
  \addplot[red,samples=1000]{\plotcommand};
}
\begin{document}
    \begin{tikzpicture}
        \begin{axis}[domain=0:100]
            \plotwave{{100,200},{10,20}};
        \end{axis}
    \end{tikzpicture}
\end{document}