

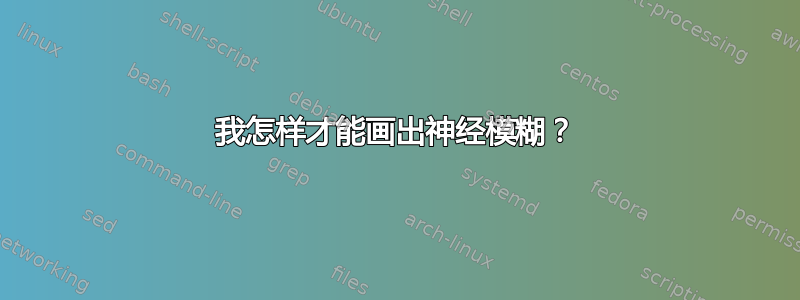
我尝试重现下图,但是在将输入 x1 和 x2 与“第 1 层”的前四个块连接起来以及将第 1 层与“第 2 层”的节点连接起来时遇到了困难。

这是我的代码:
    \documentclass[tikz, border=0.125cm]{standalone}
\usetikzlibrary{calc, fit, positioning, quotes}% new libraries
   \begin{document}
\tikzset{
  every neuron/.style={rectangle, draw, minimum size=8mm},
  layer labels/.style={above, align=center},
  cercle/.style={circle,draw,fill=black!25,minimum size=17pt,inner sep=0pt}
        }
    \begin{tikzpicture}[x=16mm, y=16mm, >=stealth]
% neuron nodes with part of labels
\foreach \g  [count=\y] in {1,2,3,4}
\foreach \b/\l in { 0/L}
{
\node[every neuron/.try, neuron \g/.try](n\b\g) at (\b,2.5-\y){}


}
\foreach \m [count=\y] in {1,2}
\foreach \j/\l in { 2/H, 4/S}
{
\ifnum\y<3
\node [every neuron/.try, neuron \m/.try] (n\j\m) at (\j,2.5-\y) {};
\else
\node [every neuron/.try, neuron \m/.try] (n\j\m) at (\j,2.5-\y) {};
\fi
}
% neuron labels not included in neuron nodes
%\foreach \l/\k in {I_K/0, H_L/2}
%\node [above] at (n\k2.north) {$\l$};
% inputs
\foreach \l [count=\i] in {1,2}
\draw [<-] (n0\i.west) -- ++(-1.1,0) node (in\i) [above, midway] {$x_\l$};
%\node (input) [draw, inner ysep=2mm, yshift=-2mm, fit=(in1) (in2)] {};
% w and L outputs
\foreach \l [count=\i] in {1,2}
\draw [->] (n4\i.east) -- ++(1.6,0)
    node (wout\i) [above, midway] {$x_\l$}
   node (Lout\i) [right, draw, minimum size=8mm, label=$L_\i$] {};% Local Model

% output
\node (output) [cercle,right=16mm] at ($(Lout1.east)!0.5!(Lout2.east)$) {};
\draw [->] (output.east) to["$\hat{y}$"] ++(1.1,0);
% neurons interconection
 \foreach \i in {1,2}
 \foreach \j in {1,2}
{
\draw [->] (n0\i) -- (n2\j);
\draw [->] (n2\i) -- (n4\j);
}
\foreach \j [count=\i] in {1,2}
\draw [->] (Lout\i.east) to ["$\hat{y}_\j$"] (output);
% neuron layers labels
\foreach \l [count=\x from 0] in {1,2,3,4,5}
\node [layer labels] at (\x*2,2.2) {Couche \\\l};
%\node [layer labels] at (6,2.2)    {Local \\ Model};
%\node [layer labels] at (8,2.2)    {Output \\ Agregation};
% x-fit L-fit conections


   \end{tikzpicture}

   \end{document}
答案1
我不确定你到底想要什么,但如果你想要一个可以开始x_1和x_2线条的单点,你可以使用:
\foreach \l [count=\i] in {1,2} {
    \draw [->, red] (-1.1,1.0) -- (n0\i.west)
        node (in\i) [above, midway] {$x_\l$};
}

代码:
\documentclass[border=0.125cm]{standalone}
\usepackage{tikz}
\usetikzlibrary{calc, fit, positioning, quotes}% new libraries
\begin{document}
\tikzset{
  every neuron/.style={rectangle, draw, minimum size=8mm},
  layer labels/.style={above, align=center},
  cercle/.style={circle,draw,fill=black!25,minimum size=17pt,inner sep=0pt}
        }
    \begin{tikzpicture}[x=16mm, y=16mm, >=stealth]
% neuron nodes with part of labels
\foreach \g  [count=\y] in {1,2,3,4}
\foreach \b/\l in { 0/L}
{
    \node[every neuron/.try, neuron \g/.try](n\b\g) at (\b,2.5-\y){};
}
\foreach \m [count=\y] in {1,2}
\foreach \j/\l in { 2/H, 4/S}
{
\ifnum\y<3
\node [every neuron/.try, neuron \m/.try] (n\j\m) at (\j,2.5-\y) {};
\else
\node [every neuron/.try, neuron \m/.try] (n\j\m) at (\j,2.5-\y) {};
\fi
}
% neuron labels not included in neuron nodes
%\foreach \l/\k in {I_K/0, H_L/2}
%\node [above] at (n\k2.north) {$\l$};
% inputs
\foreach \l [count=\i] in {1,2} {
    \draw [->, red] (-1.1,1.0) -- (n0\i.west)  node (in\i) [above, midway] {$x_\l$};
}
%\node (input) [draw, inner ysep=2mm, yshift=-2mm, fit=(in1) (in2)] {};
% w and L outputs
\foreach \l [count=\i] in {1,2}
\draw [->] (n4\i.east) -- ++(1.6,0)
    node (wout\i) [above, midway] {$x_\l$}
   node (Lout\i) [right, draw, minimum size=8mm, label=$L_\i$] {};% Local Model

% output
\node (output) [cercle,right=16mm] at ($(Lout1.east)!0.5!(Lout2.east)$) {};
\draw [->] (output.east) to["$\hat{y}$"] ++(1.1,0);
% neurons interconection
 \foreach \i in {1,2}
 \foreach \j in {1,2}
{
\draw [->] (n0\i) -- (n2\j);
\draw [->] (n2\i) -- (n4\j);
}
\foreach \j [count=\i] in {1,2}
\draw [->] (Lout\i.east) to ["$\hat{y}_\j$"] (output);
% neuron layers labels
\foreach \l [count=\x from 0] in {1,2,3,4,5}
\node [layer labels] at (\x*2,2.2) {Couche \\\l};
%\node [layer labels] at (6,2.2)    {Local \\ Model};
%\node [layer labels] at (8,2.2)    {Output \\ Agregation};
% x-fit L-fit conections
\end{tikzpicture}
\end{document}
答案2
您可以尝试以下操作:
\documentclass[tikz, border=0.125cm]{standalone}
\usetikzlibrary{calc, positioning, quotes} % new libraries

\begin{document}

\tikzset{
  every neuron/.style={rectangle, draw, minimum size=8mm},
  layer labels/.style={above, align=center},
  cercle/.style={circle,draw,fill=black!25,minimum size=17pt,inner sep=0pt}
}

\begin{tikzpicture}[x=16mm, y=16mm, >=stealth]

% neuron nodes with part of labels
\foreach \g  [count=\y from 0] in {1,2,3,4} {
\foreach \b/\l in {0/L} {
    \node[every neuron/.try, neuron \g/.try](n\b\g) at (\b,2.5-\y){};
} }

\foreach \m [count=\y] in {1,2} {
\foreach \j/\l in {2/H, 4/S} {
    \ifnum\y<3
    \node [every neuron/.try, neuron \m/.try] (n\j\m) at (\j,2.5-\y) {};
    \else
    \node [every neuron/.try, neuron \m/.try] (n\j\m) at (\j,2.5-\y) {};
    \fi
} }

% inputs
\foreach \i/\j/\k in {1/2/x,3/4/y} {
    \draw [<->] (n0\i.west) -- ++(-1.1,-.5) node[left] {$\k$} -- (n0\j.west);
}

% w and L outputs
\foreach \l [count=\i] in {1,2} {
    \draw [->] (n4\i.east) -- ++(1.6,0)
    node (wout\i) [above, midway] {$x_\l$}
    node (Lout\i) [right, draw, minimum size=8mm, label=$L_\i$] {};
}

% output
\node (output) [cercle,right=16mm] at ($(Lout1.east)!0.5!(Lout2.east)$) {};
\draw [->] (output.east) to["$\hat{y}$"] ++(1.1,0);

% neurons interconection
\foreach \i [count=\j] in {1,2,1,2} {
    \draw [->] (n0\j) -- (n2\i);
}
\foreach \i in {1,2} {
\foreach \j in {1,2} {
    \draw [->] (n2\i) -- (n4\j);
} }

\foreach \j [count=\i] in {1,2} {
    \draw [->] (Lout\i.east) to ["$\hat{y}_\j$"] (output);
}

% neuron layers labels
\foreach \l [count=\x from 0] in {1,2,3,4,5} {
    \node [layer labels] at (\x*2,3) {Couche \\ \l};
}

\end{tikzpicture}

\end{document}
