

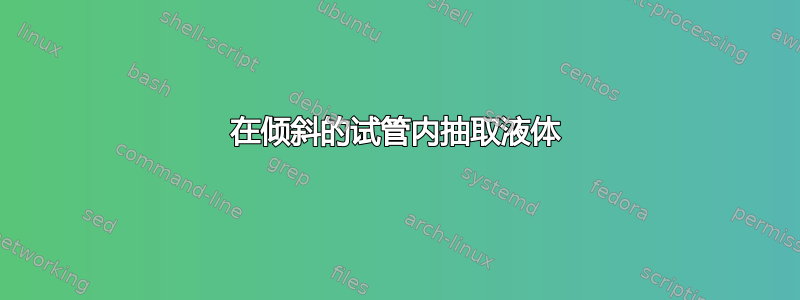
我正在尝试改变倾斜试管内的水,使得该试管内的水像黄线所示那样向上流动。
有人能帮我吗?

\documentclass[]{article}
\usepackage[margin=0.5in]{geometry}
\usepackage{pgfplots}
\renewcommand{\thesection}{\arabic{section}}
\usepackage{mathtools}
\usepackage{cancel}
\usepackage{pgfplots}
\usetikzlibrary{arrows}
\usepackage{polynom}
\usepackage{wallpaper}
\usepackage{flexisym}
\usepackage{caption}
\usepackage{varwidth}
\usepackage{lscape}
\usetikzlibrary{calc}
\usetikzlibrary{shapes.misc}
\usetikzlibrary{arrows.meta,decorations.markings}
\usetikzlibrary{arrows}
\usepgfplotslibrary{fillbetween}
\usepgfplotslibrary{statistics}
\newenvironment{tightcenter}{
\setlength\topsep{0pt}
\setlength\parskip{0pt}
\begin{center}}{\end{center}}
\begin{document}
\begin{tikzpicture}
%TEST TUBE #1
\fill[color=gray!30] (-0.75,-3) arc (180:0:0.75 and 0.2) -- (0.75,-5) arc (0:-180:0.75);
\fill[color=black!70] (0,-3) ellipse (0.75 and .2);
%
\draw[thick] (0.75,0) -- (0.75,-5) arc (0:-180:0.75) -- (-0.75,0);
\draw[thick] (0,0) ellipse (0.75 and 0.2);
%
%
%TEST TUBE #2
\fill[color=gray!30][rotate around={+50.8:(-0.41,2.86)}] (-0.75,-3) arc (180:0:0.75 and 0.2) -- (0.75,-5) arc (0:-180:0.75);
\fill[color=black!70][rotate around={+50.8:(-0.41,2.86)}]  (0,-3) ellipse (0.75 and .2);
%
\draw[thick][rotate around={+50.8:(-0.41,2.86)}]  (0.75,0) -- (0.75,-5) arc (0:-180:0.75) -- (-0.75,0);
\draw[thick][rotate around={+50.8:(-0.41,2.86)}]  (0,0) ellipse (0.75 and 0.2);
\end{tikzpicture}
\end{document}
答案1
好的,这是一个非常丑陋的这样做的方式。我的意思是,没有计算,只是即时绘制。所以它不容易定制,但既然你要求一次性……

\documentclass[]{article}
\usepackage[margin=0.5in]{geometry}
\usepackage{pgfplots}
\renewcommand{\thesection}{\arabic{section}}
\usepackage{mathtools}
\usepackage{cancel}
\usepackage{pgfplots}
\usetikzlibrary{arrows}
\usepackage{polynom}
\usepackage{wallpaper}
\usepackage{flexisym}
\usepackage{caption}
\usepackage{varwidth}
\usepackage{lscape}
\usetikzlibrary{calc}
\usetikzlibrary{shapes.misc}
\usetikzlibrary{arrows.meta,decorations.markings}
\usetikzlibrary{arrows}
\usepgfplotslibrary{fillbetween}
\usepgfplotslibrary{statistics}
\newenvironment{tightcenter}{
\setlength\topsep{0pt}
\setlength\parskip{0pt}
\begin{center}}{\end{center}}
\begin{document}
\begin{tikzpicture}
    %TEST TUBE #1
    \fill[color=gray!30] (-0.75,-3) arc (180:0:0.75 and 0.2) -- (0.75,-5) arc (0:-180:0.75);
    \fill[color=black!70] (0,-3) ellipse (0.75 and .2);
    %
    \draw[thick] (0.75,0) -- (0.75,-5) arc (0:-180:0.75) -- (-0.75,0);
    \draw[thick] (0,0) ellipse (0.75 and 0.2);
    %
    %
\end{tikzpicture}%
\hspace*{2cm}
\begin{tikzpicture}
    %%TEST TUBE #2
    \fill[color=gray!30][rotate around={+50.8:(-0.41,2.86)}] (-0.75,-2.5) -- (0.75,-4.2) -- (0.75,-5) arc (0:-180:0.75) -- cycle;

    \fill[black!70] (3.52,-.75) arc (180:-180:1.15 and 0.25);
    \draw[thick][rotate around={+50.8:(-0.41,2.86)}]  (0.75,0) -- (0.75,-5) arc (0:-180:0.75) -- (-0.75,0);
    \draw[thick][rotate around={+50.8:(-0.41,2.86)}]  (0,0) ellipse (0.75 and 0.2);
\end{tikzpicture}
\end{document}