

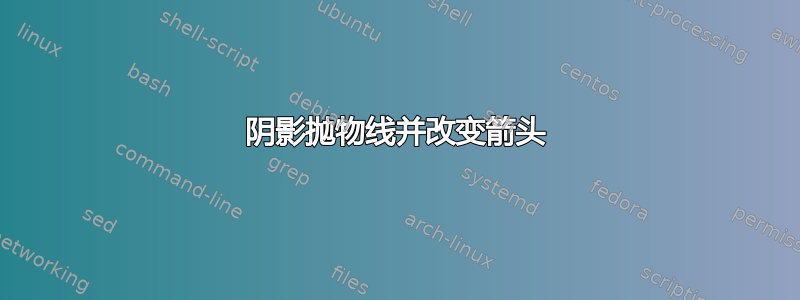
我正在尝试为抛物线的下半部分添加阴影,而且我用于费曼图的箭头应该位于中间,而不是边缘。我编写的代码如下,
\documentclass{article}
\usepackage[utf8]{inputenc}
\usepackage{graphicx}
\usepackage{geometry}
\usepackage{marginnote}
\geometry{a4paper,total={170mm,257mm},left=10mm,right=15mm,top=15mm,bottom=15mm}
\usepackage{ulem}
\usepackage{simpler-wick}
\usepackage{amsmath}
\usepackage{xcolor}
\usepackage{amssymb}
\usepackage{bbold}
\usepackage{empheq}
\usepackage{lscape}
\usepackage[T1]{fontenc}
\usepackage[utf8]{inputenc}
\usepackage{cancel}
\usepackage{relsize}
\usepackage{cjhebrew}
\usepackage{amsfonts}
\usepackage{esvect}
\usepackage{esint}
\usepackage{csquotes}
\usepackage{float}
\usepackage{physics}
\usepackage{tikz}
\usepackage{siunitx}
\usetikzlibrary{decorations.pathreplacing}
\usepackage[compat=1.0.0]{tikz-feynman}
\usepackage{framed} % or, "mdframed"
\usepackage[framed]{ntheorem}
\newframedtheorem{frm-thm}{Theorem}
\usepackage{marvosym}
\usepackage{simplewick}
\usepackage{caption}
\usepackage{scalerel,amssymb}
\def\mcirc{\mathbin{\scalerel*{\circ}{j}}}
\def\msquare{\mathord{\scalerel*{\Box}{gX}}}
\tikzset{snake it/.style={decorate, decoration=snake}}

\begin{document}
\begin{center}
\begin{tikzpicture}
%\draw[step=1cm,gray,very thin] (-5,-5) grid (10,10);
%left co-ordinate
\draw[,line width=0.3mm,black,<->](-4,4) -- (2,4);
\draw[,line width=0.3mm,black,->](-1,1) -- (-1,8);
% draw everything on left
\draw[thick,black](-1,2.5) parabola (2,7.5);
\draw[thick,red](-1,2.5) parabola (-4,7.5);
\node at (.80,3.6) {$p_{F}$};
\node at (1.5,5) {R};
\node at (-3.5,5) {\textcolor{red}{L}};
\node at (-2.8,3.6) {$-p_{F}$};
\node at (2.2,4) {$p$};
\node at (-1,8.2) {$\varepsilon(p)$};
\node at (-1,0.75) {\textbf{(a)}};
\node at (6,0.75) {\textbf{(b)}};
%right co-ordinate
\draw[,line width=0.3mm,black,<->](3,4) -- (9,4);
\draw[,line width=0.3mm,black,->](6,1) -- (6,8);
\node at (9.2,4) {$p$};
\node at (6,8.2) {$\varepsilon(p)$};
%left dotted line
\draw[,line width=0.3mm,black,dashed](4,1) -- (6,3);
\draw[,line width=0.3mm,black](6,3) -- (9,6);
%right dotted line
\draw[,line width=0.3mm,black,dashed,red](8,1) -- (6,3);
\draw[,line width=0.3mm,red](6,3) -- (3,6);
%shade the fermi sea
\coordinate (A1) at (6,3);
\coordinate (A2) at (5,4);
\coordinate (A3) at (7,4);
% Draw the sides of the triangle
%\draw (A1) -- (A2) -- (A3) -- cycle;
\shade [color=blue] (A1) -- (A2) -- (A3) -- cycle;
%mark A1
\draw[,line width=0.3mm,black,-](5.8,3) -- (6.2,3);
\node at (6.8,3) {$-v_{F}p_{F}$};
%mark A2
\draw[,line width=0.3mm,black,-](5,4.2) -- (5,3.8);
\node at (5,3.6) {$-p_{F}$};
%mark A3
\draw[,line width=0.3mm,black,-](7,4.2) -- (7,3.8);
\node at (7,3.6) {$p_{F}$};
\node at (8.5,5) {R};
\node at (7,3.6) {$p_{F}$};
\node at (3.5,5) {\textcolor{red}{L}};
%draw little Feynman diagram of back-scattering
\draw [-stealth,very thick,red](-2,-2) -- (-1,-1);
\draw [-stealth,very thick,black](-1,-1) -- (-2,0);
\draw[draw=black, snake it,very thick] (-1,-1)--(0,-1);
\draw [-stealth,very thick,black](1,-2) -- (0,-1);
\draw [-stealth,very thick,red](0,-1) -- (1,0);
\node at (-0.5,-0.7) {$g_{2}$};
\node at (-0.5,-2) {(\textbf{c})};
%draw little Feynman diagram of forward-scattering
\draw [-stealth,very thick,black](2,-2) -- (3,-1);
\draw [-stealth,very thick,black](3,-1) -- (2,0);
\draw[draw=black, snake it,very thick] (3,-1)--(4,-1);
\draw [-stealth,very thick,black](5,-2) -- (4,-1);
\draw [-stealth,very thick,black](4,-1) -- (5,0);
\node at (3.5,-0.7) {$g_{1}$};
\node at (3.5,-2) {(\textbf{d})};
% draw little Feynman diagram of umklapp scattering
\draw [-stealth,very thick,black](6,-2) -- (7,-1);
\draw [-stealth,very thick,red](7,-1) -- (6,0);
\draw[draw=black, snake it,very thick] (7,-1)--(8,-1);
\draw [-stealth,very thick,black](9,-2) -- (8,-1);
\draw [-stealth,very thick,red](8,-1) -- (9,0);
\node at (7.5,-0.7) {$g_{1}$};
\node at (7.5,-2) {(\textbf{d})};
\end{tikzpicture}
\caption{}
\end{center}
\end{document}
有人能帮忙解决这些问题吗?提前谢谢。
答案1
所有图像具有相同的坐标系和范围,彼此之间有一定偏移。这样可以简化图像代码。
编辑(1): 哎呀,我忘了费曼图。现在已添加/更正。
编辑(2): 被认为是 OP 评论,删除了未使用的选项和包,添加了标题
\documentclass[border=3.141592, varwidth=210mm]{standalone}
\usepackage{pgfplots}
\usepackage{tikz-feynman}
\usetikzlibrary{arrows.meta,
                backgrounds,
                intersections,
                pgfplots.fillbetween,
                quotes
                }
\usepackage[low-sup]{subdepth}

\begin{document}
    \begin{figure}[ht]\centering
    \begin{tikzpicture}[> = {Straight Barb[scale=1.2]}]
% axis
\draw[<->](-3,0) -- ++ (6,0) node[right] {$p$};;
\draw[ ->](0,-2) node[below, font=\bfseries] {(a)}
                 -- ++ (0,5) node[above] {$\varepsilon(p)$};
%
\draw[thick,red]    (0,-1) parabola (-2,3) node[below=1] {L};
\draw[thick]        (0,-1) parabola ( 2,3) node[below=1] {R};
\path[name path=C]  plot[domain=-1:1,samples=41] (\x,\x*\x-1) ;
\draw[name path=X]
        (-1,0) coordinate[label=below:$p_{F}$]  (a) --
        ( 1,0) coordinate[label=below:$-p_{F}$] (b);
\scoped[on background layer]
    \tikzfillbetween[of=C and X]{gray!30};
%
    \begin{scope}[xshift=80mm]
\draw[<->](-3,0) -- ++ (6,0) node[right] {$p$};;
\draw[ ->](0,-2) node[below, font=\bfseries] {(b)}
                 -- ++ (0,5) node[above] {$\varepsilon(p)$};
\draw[thick,dashed] (-1,-2) -- (0,-1);
\draw[thick]        ( 0,-1) -- (3, 2) node[pos=0.7,right=1mm] {R};
\draw[thick,red,dashed] (-3,2) -- (0,-1) node[pos=0.3,left=1mm] {L};
\draw[thick,red,]       (0,-1) -- (1,-2);
\path[name path=C]  (-1,0) -- (0,-1) -- (1,0);
\draw[name path=X]
        (-1,0) coordinate[label=below:$p_{F}$]  (a) --
        ( 1,0) coordinate[label=below:$-p_{F}$] (b);
\scoped[on background layer]
    \tikzfillbetween[of=C and X]{gray!30};
\draw   (-0.2,-1) -- (0.2,-1) node[right] {$-v_{F}p_{F}$};
    \end{scope}
%
%%%%    Feynman diagrams
%
    \begin{scope}[yshift=-40mm,
                   line width=1pt]
    \begin{feynman}
\vertex (a1) at (-1.5,-1);
\vertex (a2) at (-0.5, 0);
\vertex (a3) at (-1.5, 1);
\vertex (b1) at (1.5,-1);
\vertex (b2) at (0.5, 0);
\vertex (b3) at (1.5, 1);
    \diagram [small] {
    (a1) -- [fermion, red] (a2) -- [fermion] (a3),
    (a2) -- [photon,"$g_2$"]  (b2),
    (b1) -- [fermion] (b2) -- [fermion] (b3),
    };
    \end{feynman}
\node[below=9mm, font=\bfseries]    {(c)};
    \end{scope}
%
    \begin{scope}[yshift=-40mm,xshift=40mm,
    line width=1pt]
    \begin{feynman}
\vertex (a1) at (-1.5,-1);
\vertex (a2) at (-0.5, 0);
\vertex (a3) at (-1.5, 1);
\vertex (b1) at (1.5,-1);
\vertex (b2) at (0.5, 0);
\vertex (b3) at (1.5, 1);
    \diagram [small] {
    (a1) -- [fermion] (a2) -- [fermion] (a3),
    (a2) -- [photon,"$g_2$"]  (b2),
    (b1) -- [fermion] (b2) -- [fermion] (b3),
    };
    \end{feynman}
\node[below=9mm, font=\bfseries]    {(d)};
    \end{scope}
%
    \begin{scope}[yshift=-40mm,xshift=80mm,
                  line width=1pt]
    \begin{feynman}
\vertex (a1) at (-1.5,-1);
\vertex (a2) at (-0.5, 0);
\vertex (a3) at (-1.5, 1);
\vertex (b1) at (1.5,-1);
\vertex (b2) at (0.5, 0);
\vertex (b3) at (1.5, 1);
    \diagram [small] {
    (a1) -- [fermion] (a2) -- [fermion, red] (a3),
    (a2) -- [photon,"$g_2$"]  (b2),
    (b1) -- [fermion] (b2) -- [fermion, red] (b3),
    };
    \end{feynman}
\node[below=9mm, font=\bfseries]    {(e)};
    \end{scope}
    \end{tikzpicture}
   \caption{Diagrams}
   \end{figure}
\end{document}
