

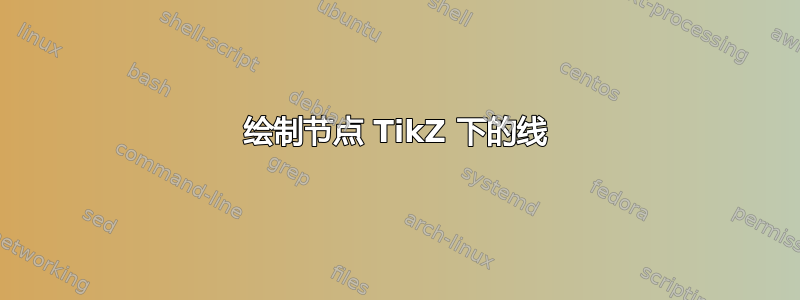
我有一个有向图,我想在其中绘制垂直线,就像这里手工添加的三条红线一样:

每个部分代表一个时间段。注释e1和v1名称相邻节点。它们不需要出现在输出中。
我尝试使用
\draw[dotted] ([yshift=-1.9cm]e1.south) -- ([yshift=0.5cm]v1.north)
其中e1和v1是标记节点,另外两对节点有类似的语句,并将所有三个语句插入到代码末尾。
%Preamble
\documentclass{article}
\usepackage{tikz}
\usetikzlibrary{positioning, shapes.geometric}

\begin{document}
% Original graph starts here
\begin{tikzpicture}[label/.style = {draw, fill=white, ellipse, scale=0.8, inner sep=0.07cm, minimum height=0.6cm, minimum width=1cm},
                    node/.style = {minimum height=0.6cm, minimum width=1cm},
                    s>/.style = {->,out=90,in=210,looseness=1.5, dotted}]
%Nodes:
\node[draw] (vt-1) {$\tilde{V}_{it-1}$};
\node[draw] (st-1) [right = 1.6cm of vt-1, node] {$S_{it-1}$};
\node[draw] (st)   [right = 2.4cm of st-1, node] {$S_{it}$};
\node[draw] (it)   [below = 2.2cm of st  , node] {$\tilde{I}_{it}$};
\node[draw] (st+1) [right = 2.4cm of st  , node] {$S_{it+1}$};
\node[draw] (it+1) [below = 2.2cm of st+1, node] {$\tilde{I}_{it+1}$};
\node (st+2) [right = 2.4cm of st+1, node] {...};
\node (it+2) [below = 2.2cm of st+2, node] {...};

%Lines from t-1 -> t
\draw[->] (vt-1) to node[label](v0){$-1$} (st-1);
\draw[->] (st-1) to node[label](v1){$-1$} (st);
\draw[->] (st-1) to node[label](e1){$-e(t-1)$} (it);

%Lines from t -> t+1
\draw[->] (st)   to node[label](v2){$-1$} (st+1);
\draw[->] (st)   to node[label](e2){$-e(t)$} (it+1);
\draw[s>] (it)   to node[label, pos=0.2]{$e(t-1)$} (st+1);
\draw[->] (it)   to (e2);

%Lines from t+1 -> \infty
\draw[->] (st+1)   to node[label](v3){$-1$}(st+2);
\draw[->] (st+1)   to node[label](e3){$-e(t+1)$} (it+2);
\draw[s>] (it+1)   to node[label, pos=0.2]{$e(t)$} (st+2);
\draw[->] (it+1)   to (e3);

%Text with t-1, t, ...
\node [above = 0.2cm of v0] {$t-1$};
\node [above = 0.2cm of st] {$t$};
\node [above = 0.2cm of st+1] {$t+1$};
\node [above = 0.2cm of st+2] {$t \rightarrow \infty$};
%Original graph ends here

%Added lines:
\draw[dashed] ([yshift=-1.9cm]e1.south) -- ([yshift=0.5cm]v1.north);
\draw[dashed] ([yshift=-1.9cm]e2.south) -- ([yshift=0.5cm]v2.north);
\draw[dashed] ([yshift=-1.9cm]e3.south) -- ([yshift=0.5cm]v3.north);
\end{tikzpicture}
\end{document}
结果如下:

但我希望线条位于节点后面。
我想象可以从e1.south到 图的南端画一条线,从e1.north到 再画一条v1.south线,从 到 图的北端再画一条e1.north线(其余对也一样)。但是:(i)似乎应该有一个更好的解决方案,(ii)我不知道如何从一个节点画一条线到一个没有节点的点。观察:所谓“图的北端”,我指的是 x 坐标相同且 y 坐标 +0.5 厘米的点。
答案1
您可以使用手册中描述的 Tikz 背景库来执行此操作。我将该库添加到\usetikzlibrary参数列表中已有的列表中,并修改了代码的最后几行,以将垂直线放在背景中。结果如下。
%Preamble
\documentclass{article}
\usepackage{tikz}
\usetikzlibrary{positioning, shapes.geometric, backgrounds}

\begin{document}
% Original graph starts here
\begin{tikzpicture}[label/.style = {draw, fill=white, ellipse, scale=0.8, inner sep=0.07cm, minimum height=0.6cm, minimum width=1cm},
                    node/.style = {minimum height=0.6cm, minimum width=1cm},
                    s>/.style = {->,out=90,in=210,looseness=1.5, dotted}]
%Nodes:
\node[draw] (vt-1) {$\tilde{V}_{it-1}$};
\node[draw] (st-1) [right = 1.6cm of vt-1, node] {$S_{it-1}$};
\node[draw] (st)   [right = 2.4cm of st-1, node] {$S_{it}$};
\node[draw] (it)   [below = 2.2cm of st  , node] {$\tilde{I}_{it}$};
\node[draw] (st+1) [right = 2.4cm of st  , node] {$S_{it+1}$};
\node[draw] (it+1) [below = 2.2cm of st+1, node] {$\tilde{I}_{it+1}$};
\node (st+2) [right = 2.4cm of st+1, node] {...};
\node (it+2) [below = 2.2cm of st+2, node] {...};

%Lines from t-1 -> t
\draw[->] (vt-1) to node[label](v0){$-1$} (st-1);
\draw[->] (st-1) to node[label](v1){$-1$} (st);
\draw[->] (st-1) to node[label](e1){$-e(t-1)$} (it);

%Lines from t -> t+1
\draw[->] (st)   to node[label](v2){$-1$} (st+1);
\draw[->] (st)   to node[label](e2){$-e(t)$} (it+1);
\draw[s>] (it)   to node[label, pos=0.2]{$e(t-1)$} (st+1);
\draw[->] (it)   to (e2);

%Lines from t+1 -> \infty
\draw[->] (st+1)   to node[label](v3){$-1$}(st+2);
\draw[->] (st+1)   to node[label](e3){$-e(t+1)$} (it+2);
\draw[s>] (it+1)   to node[label, pos=0.2]{$e(t)$} (st+2);
\draw[->] (it+1)   to (e3);

%Text with t-1, t, ...
\node [above = 0.2cm of v0] {$t-1$};
\node [above = 0.2cm of st] {$t$};
\node [above = 0.2cm of st+1] {$t+1$};
\node [above = 0.2cm of st+2] {$t \rightarrow \infty$};
%Original graph ends here

%Added lines:
\begin{scope}[on background layer]
  \draw[dashed] ([yshift=-1.9cm]e1.south) -- ([yshift=0.5cm]v1.north);
  \draw[dashed] ([yshift=-1.9cm]e2.south) -- ([yshift=0.5cm]v2.north);
  \draw[dashed] ([yshift=-1.9cm]e3.south) -- ([yshift=0.5cm]v3.north);
\end{scope}

\end{tikzpicture}
\end{document}

答案2
一些题外的评论和建议(因为问题已经由其他答案解决):
- 我认为使用样式名称不是一个好主意,这些名称在
\tikz命令中使用:\node或node和label。这很容易出错...更好的方法是例如选择Nfornode和Lforlabel。它们可以很容易地与同名的命令区分开来,而且也短得多。 - 您的图像比包
\textwidth的默认宽度要宽。使用节点样式定义不是好的解决方案,更好的方法是:articlescale- 定义较小的字体和水平节点距离,例如分别
\footnotesize和node distance = 22mm and 19mm;或 \textwidth使用geometry包增加文档
- 定义较小的字体和水平节点距离,例如分别
- 通过使用
chains库和\foreach循环来定位节点,您的图像代码可以变得更短:
\documentclass{article}
\usepackage{amsmath}
\usepackage{tikz}
\usetikzlibrary{arrows.meta,
                backgrounds,
                chains,
                positioning,
                shapes.geometric}

\begin{document}
    \begin{table}[ht]
    \centering
    \footnotesize
% Original graph starts here
    \begin{tikzpicture}[
            > = Straight Barb,
node distance = 22mm and 24mm,
  start chain = going right,
     L/.style = {ellipse, draw, fill=white,
                 inner xsep=#1, inner ysep=2pt},
     L/.default = 1pt,
     N/.style = {draw, minimum width=3em},
    s>/.style = {->, out=90, in=195, looseness=1.2, dotted}
                        ]
% nodes in chain:
    \foreach \i [count=\j] in {\tilde{V}_{it-1}, S_{it-1}, S_{it}, S_{it+1}, \dotsm}
{
\ifnum\j<5
    \node (s\j) [N, on chain, join=by ->] {$\i$};
\else
    \node (s\j) [on chain, join=by ->] {$\i$};
\fi
}
% nodes "-1" in chain
    \foreach \i [count=\j from 2] in {1,2,3,4}
\path (s\i) -- node (h\i) [L] {$-1$} (s\j);
% nodes at top
\node   [above=5mm] at (h1)   {$t-1$};
\node   [above=5mm] at (s3)   {$t$};
\node   [above=5mm] at (s4)   {$t+1$};
\node   [above=5mm] at (s5)   {$t\to\infty$};
% nodes at bottom
\node (i1) [N, below = of s3]   {$\tilde{I}_{it}$};
\node (i2) [N, below = of s4]   {$\tilde{I}_{it+1}$};
\node (i3) [below = of s5]      {$\dotsm$};
% diagonal lines with nodes
\draw[->] (s2) -- node (e1) [L=-3pt] {$-e(t-1)$} (i1);
\draw[->] (s3) -- node (e2) [L]      {$-e(t)$}   (i2);
\draw[->] (s4) -- node (e3) [L=-3pt] {$-e(t+1)$} (i3);
%
\draw[->] (i1) -- (e2);
\draw[->] (i2) -- (e3);
% dotted curved lines
\draw[s>] (i1) to node[L=-3, pos=0.3]{$e(t-1)$} (s4.200);
\draw[s>] (i2) to node[L, pos=0.3]{$e(t)$} (s5.200);
%
% vertical dashed lines:
\scoped[on background layer]
{
\foreach \x in {2,3,4}
  \draw[dashed] ([yshift=5mm] h\x.north) -- ([yshift=-5mm] h\x |- i1.south);
}
\end{tikzpicture}
    \end{table}
\end{document}

(红线表示文字边框)