

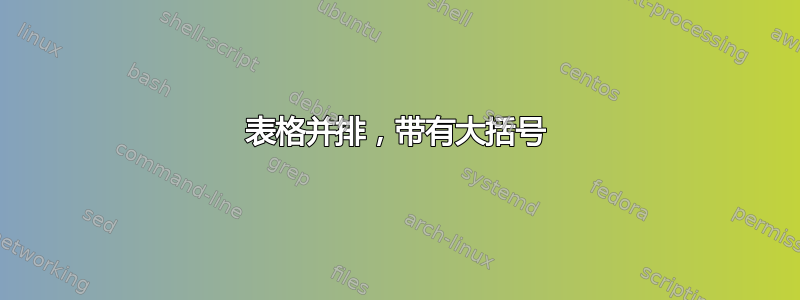
我正在尝试在 LaTex 中重新创建以下设计:

我该如何做呢?
答案1
有很多方法可以做到这一点。这是一个使用
- 这
matrix图书馆风格matrix of math nodes和left delimiter关键 - 这
positioning图书馆使用(垂直) 和水平node distance来与和 一起使用。1em5emabove rightbelow right
着色是用path picture它基本上是放置在节点(或在本例中为矩阵)后面的任何 TikZ 绘图。
由于矩阵的内容非常统一,我将设置样式pooling matrix,使其单元格节点的内容右对齐,但使用两个数字的固定宽度(text width=width("00"))。如果您使用更复杂的矩阵内容,则需要进行调整。
这个path picture工作很简单,因为我还假设矩阵是由大小相等的 2x2 场组成的。
线路
\path[local bounding box=right side] (top.north-|top-label.west)
                               (bottom.south-|bottom-label.west);
构造一个紧密节点,其名称right side包含rectangle两个指定的坐标,其中<c1>-|<c2><c1>是与 水平且与 垂直的点<c2>。
对于这种形式的更复杂的运算,fit图书馆可以使用。
我引用这个名为的节点right side来在左边late options添加。[left delimiter][3]
代码
\documentclass[tikz]{standalone}
\usetikzlibrary{matrix,positioning,arrows.meta}
\tikzset{
  tight matrix/.style={every outer matrix/.append style={inner sep=+0pt, outer sep=+0pt}},
  four colors/.style={path picture={
    \path[4c top left/.try] (path picture bounding box.north west) rectangle (path picture bounding box.center);
    \path[4c top right/.try] (path picture bounding box.north east) rectangle (path picture bounding box.center);
    \path[4c bottom left/.try] (path picture bounding box.south west) rectangle (path picture bounding box.center);
    \path[4c bottom right/.try] (path picture bounding box.south east) rectangle (path picture bounding box.center);}},
  define four color fills/.style n args={4}{
    4c top left/.append style={fill=#1},    4c top right/.append style={fill=#2},
    4c bottom left/.append style={fill=#3}, 4c bottom right/.append style={fill=#4}},
  pooling matrix/.style={
    tight matrix, matrix of math nodes, four colors,
    cells={nodes={draw, align=right, text width=width("00")}},
    row sep=-.5\pgflinewidth, column sep=-.5\pgflinewidth,
    Label/.style={label={[pooling matrix label]above:##1 pooling}}
  },
  pooling matrix text/.style={font=\scriptsize\sffamily, inner sep=.1666em},
  pooling matrix label/.style={name/.expanded=\tikzlastnode-label, pooling matrix text}
}
\begin{document}
\begin{tikzpicture}[
  define four color fills={blue!50}{orange!50}{green!50!gray}{red!50!gray!70!white},
  node distance=1em and 7em,
]
  \matrix[pooling matrix] (left) {
    8 & 7 &  5 &  3 \\
   12 & 9 &  5 &  7 \\
   13 & 2 & 10 &  3 \\
    9 & 4 &  5 & 14 \\ };
  \matrix[pooling matrix, above right=of left.east, Label=Max] (top) {
    12 & 7 \\ 13 & 14 \\ };
  \matrix[pooling matrix, below right=of left.east, Label=Average] (bottom) {
    9 & 5 \\ 7 & 8 \\ };

  \path[local bounding box=right side] (top.north-|top-label.west)
                                 (bottom.south-|bottom-label.west);
  \path[every delimiter/.append style={name=brace,xshift=.5em}]
     (right side) [late options={left delimiter=(}];
  \draw[-{Stealth[round]}, thick, shorten <=1pt] (left) -- (brace) node[
     pooling matrix text, midway, align=center, above] {$2\times2$ pooling\\stride 2};
\end{tikzpicture}
\end{document}
输出

答案2
这个解决方案需要两个步骤:(1)三个矩阵的构造和(2)矩阵的布局和其余元素的插入。
第一步我使用了nicematrix包。它允许选择和更改数组的配置和装饰元素,而无需触及表格单元格的内容。如果您在其他地方生成数组并将其插入文档中,这是一个不错的功能LaTeX。
为了方便起见,我使用方形数组定义了三个命令,以便能够在不干扰布局的情况下更改它们tikz。
第二步是tikzpicture使用标准tikz命令来完成箭头、标签和元素的相对定位。

\documentclass[12pt,a4paper]{article}

\usepackage{nicematrix}
\usepackage{tikz}
\usetikzlibrary{positioning}

\begin{document}

\newcommand{\matrixA}{%
\setlength{\tabcolsep}{0pt}
\begin{NiceTabular}{*{4}{c}}[hvlines,rules/width=2pt, cell-space-limits=1.5ex,columns-width=5ex]
    \CodeBefore % color the blocks
    \rectanglecolor{blue!15}{1-1}{2-2}
    \rectanglecolor{green!15}{3-1}{4-2}
    \rectanglecolor{orange!25}{1-3}{2-4}
    \rectanglecolor{red!15}{3-3}{4-4}
    \Body
    \RowStyle[nb-rows=4]{\bfseries} % make all bold
    8&7&5&3\\
    12&9&5&7\\
    13&2&10&3\\
    9&4&5&14\\
\end{NiceTabular}
}

\newcommand{\matrixB}{%
\setlength{\tabcolsep}{0pt}
\begin{NiceTabular}{*{2}{c}}[hvlines,rules/width=1.6pt,cell-space-limits=1.5ex,columns-width=5ex]
    \CodeBefore % color the cells
    \cellcolor{blue!15}{1-1}
    \cellcolor{orange!15}{1-2}
    \cellcolor{green!15}{2-1}
    \cellcolor{red!15}{2-2}
    \Body
    \RowStyle[nb-rows=2]{\bfseries} % make all bold
    12&7\\
    13&14\\
\end{NiceTabular}
}

\newcommand{\matrixC}{%
\setlength{\tabcolsep}{0pt}
\begin{NiceTabular}{*{2}{c}}[hvlines,rules/width=1.6pt,cell-space-limits=1.5ex, columns-width=5ex]
    \CodeBefore % color the cells
    \cellcolor{blue!15}{1-1}
    \cellcolor{orange!15}{1-2}
    \cellcolor{green!15}{2-1}
    \cellcolor{red!15}{2-2}
    \Body
    \RowStyle[nb-rows=2]{\bfseries} % make all bold
    9&5\\
    7&8\\
\end{NiceTabular}
}

\begin{tikzpicture}
    % layout the matrices
    \node (matA) {\matrixA};
    \node[ above right = -30pt and 150pt of matA, scale=1.2, anchor = south west] (matB) {\matrixB};
    \node[ below right = -20pt and 150pt of matA, scale=1.2, anchor =north  west] (matC) {\matrixC};
    % a large parenthesis
    \node (paren) [right = 120pt of matA] {$\left(\rule{0pt}{130pt}\right.$};
    % the arrow
    \draw[-latex,ultra thick,  shorten >=3mm, shorten <=2mm,] (matA.east) -- (paren.center)  node[midway,above, text width=3cm,     font= \bfseries, text centered] {2x2 pooling, stride 2};
    % add the labels
    \node[above =  -3pt of matB.north,font=\bfseries]{Max pooling};
    \node[above =  -3pt of matC.north,font=\bfseries]{Average pooling};
\end{tikzpicture}

\end{document}