


在这里我使用https://mermaid.live/创建流程图。例如使用以下代码:
flowchart TB
   subgraph w1
       A
       B
       C
   end
   subgraph w2
       D
       E
   end
   subgraph w3
       F
   end
   A & B & C --> D & E
   D & E --> F
它生成:
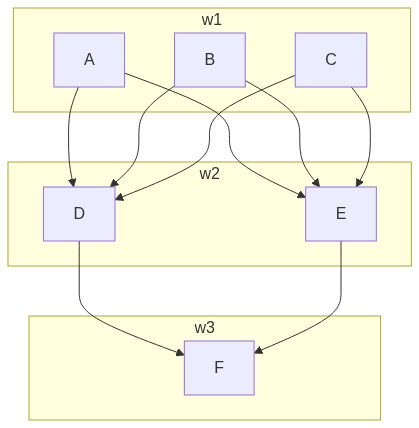
看起来美人鱼将子图作为数组处理并并排生成框。
是否可以在 tikz 中生成此示例流程图?如果可能的话,可以动态地在每个子图中添加新节点,例如:
<A B C D E ...>
  <F G H ...>
  <Y Z ...>
在以下帮助下,我能想到的最接近的答案如下:https://tex.stackexchange.com/a/357573/127048:
\documentclass[tikz,border=2pt]{standalone}
\usepackage{tikz, tikzscale}
\usepackage{paralist} % compactitem
\usetikzlibrary{
    shapes.geometric,
    arrows,
    arrows.meta,
    calc,
    positioning,
    decorations.pathreplacing,
    calligraphy, % had to be after lib. decorations.pathreplacing
    bending} % add geometric shapes and arrows for flowcharts, plus calc package, positioning for relative positions
\tikzstyle{startstop} = [rectangle, rounded corners, minimum width=3cm, minimum height=1cm, text centered, draw=black, fill=white]
\tikzstyle{process} = [rectangle, minimum width=3cm, minimum height=1cm, text centered, draw=black, fill=white]
\tikzstyle{process2} = [rectangle, minimum width=3cm, minimum height=1cm, text centered, draw=black, fill=white]
\tikzstyle{process3} = [rectangle, minimum width=3cm, minimum height=1cm, text centered, draw=black, fill=white]
\tikzstyle{arrow} = [thick,->,>=stealth]

\begin{document}
\begin{tikzpicture}[
transform shape,
node distance = 22mm and 11mm,
   box/.style = {shape=rectangle, draw, thin,
                 minimum height=10mm, text width=32mm, align=center,
                 top color=#1!20, bottom color=#1!80,
                 anchor=south west
                 },
BC/.style args = {#1/#2/#3}{ % Braces Calligraphic
        decorate,
        decoration={calligraphic brace, amplitude=6pt,
        raise=#1,
              #2, % for mirroring of brace
        aspect=#3},
        very thick
        },
]

\node (start) [process, align=center] {A};
\node (pro1) [process, right of=start, align=center, xshift=2cm] {B};
\node (pro2) [process, right of=pro1, align=center, xshift=2cm] {C};
\node (pro3) [process2, below of=start, align=center, yshift=-.5cm] {D};
\node (pro4) [process2, below of=pro2, yshift=-.5cm] {E};
\node (main) [startstop, below of=pro1, yshift= -2cm, fill=black!30] {F};
\draw[-Stealth] (start) edge (pro3)
                (start) edge (pro4)
                (pro1) edge (pro3)
                (pro1) edge (pro4)
                (pro2) edge (pro3)
                (pro2) edge (pro4)
                (pro3) edge (main)
                (pro4) edge (main)
\end{tikzpicture}
\end{document}
输出:

答案1
另一个适用于pdfLaTeX引擎的基本解决方案是:
\documentclass[margin=3mm]{standalone}
\usepackage{tikz}
\usetikzlibrary{arrows.meta,
                backgrounds,
                fit,
                positioning}

\begin{document}
    \begin{tikzpicture}[
node distance = 7mm and 7mm,
     N/.style = {draw, draw=purple, fill=purple!30,
                 minimum size=5mm, inner sep =1mm},
  FIT/.style = {draw, draw=yellow, fill=yellow!30,
                inner sep=2mm, fit=#1},
every edge/.append style = {-{Straight Barb[scale=0.8]}, semithick}
                        ]
\node[N]   (w11) {A};
\node[N, right=of w11]      (w12) {B};
\node[N, right=of w12]      (w13) {B};
%
    \begin{scope}[node distance = 7mm and 0mm]
\node[N, below right=of w11] (w21) {C};
\node[N, below right=of w12] (w22) {D};
%
\node[N, below right=of w21] (w31) {E};
    \end{scope}
%
    \begin{scope}[on background layer]
\node[FIT=(w11) (w13), label=left:$w1$] {};
\node[FIT=(w21) (w22), label=left:$w2$] {};
\node[FIT=(w31), label=left:$w3$] {};
    \end{scope}
\foreach \i in {1,2,3}
{   \draw   (w1\i) edge (w21);
    \draw   (w1\i) edge (w22);
 \ifnum\i<3
    \draw   (w2\i) edge (w31);
 \fi
}
    \end{tikzpicture}
\end{document}

答案2
我认为,无需实现新内容的最自动化的方法是将graphs库与graphdrawing库(需要 Lua)及其layered子库相结合。
该语法使用名称及其文本来描述子布局。不幸的是,标签的实现有些简单,这就是为什么我使用(即,并且不会在任何地方显示)并使用一个好的旧方法为子布局添加标签。name / text[options] // …nametexttextsubgraph text nonew1w2w3label
看起来好像子布局添加得很晚,这意味着它们将覆盖任何包含节点和边。这就是为什么我给它们每个都赋予了一个可以在图片末尾访问的正确名称。
虽然可能还有破解节点操作对于这个简单的例子,将其放在与当前不同的层上,我将采用已尝试和测试的方法。
要了解更自动化的方法,请查看\tikzsimpleflowchart:
\tikzsimpleflowchart{{A, B, C, D, E}, {F, G, H}, {I}, {J, K}}
这将不允许...(例如A, ..., E),为此,还需要做更多的工作。
这ext.node-families图书馆允许您将所有子布局节点放在一个相同宽度的系列中,但这需要两次编译运行。
处理标签(或子布局的选项)时宏\cnt不可用,这就是我在最后一步添加它们的原因。
代码
\documentclass[tikz]{standalone}
\usetikzlibrary{graphdrawing, graphs, quotes, backgrounds}
\usetikzlibrary{ext.node-families}
\usegdlibrary{layered}
\pgfqkeys{/utils/count list}{.style 2 args={/utils/exec=\def#2{0},
  /utils/temp/.code=\edef#2{\pgfinteval{#2+1}},/utils/temp/.list={#1}}}
\tikzset{
  flowchart/nodes/.style={
    draw=blue!25!red, fill=blue!50!red!50,
    text width=width("$M$"), align=center},
  flowchart/boxes fg/.style={outer sep=+0pt, /tikz/node family/width=sublayout},
  flowchart/boxes bg/.style={draw=yellow!50!black, fill=yellow!20}}
\newcommand*\tikzsimpleflowchart[2][]{%
\begin{tikzpicture}[
  subgraph nodes={/tikz/flowchart/boxes fg},
  subgraph text none, label position=left,
  /utils/count list={#2}{\itemsinlist},#1]
\graph[math nodes, nodes={/tikz/flowchart/nodes}, layered layout]{
  \foreach[
    count=\cnt,
    remember=\listitem as \lastitem (initially )]\listitem in {#2}{
    w\cnt //[layered layout]{[parse/.expand once=\listitem]},
    {[parse/.expand once=\lastitem]}
      ->[complete bipartite]
        {[parse/.expand once=\listitem]}}};
\scoped[on background layer]\foreach \cnt in {1,...,\itemsinlist}
  \path[flowchart/boxes bg]
    (w\cnt.south west) rectangle (w\cnt.north east)
    [late options={name=w\cnt,label=$w_{\cnt}$}];
\end{tikzpicture}}

\begin{document}
\begin{tikzpicture}[
  subgraph nodes={outer sep=+0pt},
  subgraph text none,
  label position=left]
\graph[
  math nodes,
  nodes={draw=blue!25!red, fill=blue!50!red!50},
  layered layout
]{
  w1["$w_1$"] //[layered layout] {A, B, C},
  w2["$w_2$"] //[layered layout] {D, E},
  w3["$w_3$"] //[layered layout] {F};
  {A, B, C} ->[complete bipartite] {D, E} -> F
};
\scoped[on background layer]\foreach \w in {1,...,3}
  \path[draw=yellow!50!black, fill=yellow!20]
    (w\w.south west) rectangle (w\w.north east);
\end{tikzpicture}
\tikzsimpleflowchart{{A, B, C, D, E}, {F, G, H}, {I}, {J, K}}
\end{document}
输出

